-
View Larger Image
Welcome to the Artificial Intelligence Outlook for Forex trading.
VIDEO TRANSCRIPT
Okay, hello everyone, and welcome back. My name is Greg Firman, and this is the Vantage Point AI Market Outlook for the week of July 15, 2024.
U.S. Dollar Index
To get started this week, we’ll begin where we always do with that very important US Dollar Index . Now, the dollar is under selling pressure, which I’ve talked about for several months now. The FED is basically being backed into a corner and is going to likely have to cut here sooner rather than later. Traders are picking up on this at the beginning of July as we start moving lower. VantagePoint is forecasting the Dollar Index to move lower on or about July 3rd, which I’ve discussed, but now we’re coming into some verified support here, with that low coming in at 103.99. That’s the immediate support for this particular week.
So remember, the dollar is still in an uptrend while we’re above 103.37. But again, there’s mounting selling pressure. The indicators are confirming that we’re a little bit oversold here at 11.3 on the predicted RSI, but we’ve just come off a retracement on the predicted RSI back to the 40 level. We’ve hit our T cross long, and we’re down again.
So, it’s a rather light week next week with retail sales. I don’t think that’s going to be a huge driver, but again, I would also warn everybody that in most cases the dollar is strong in their fiscal fourth quarter, which ends on October 1st. So I’m looking for some dollar strength, but probably not until about mid-August into September. But we will still have good two-way action between longs and shorts. For now, there is a bias against the dollar based on the indicators and the breakdown below our T cross long.
Gold
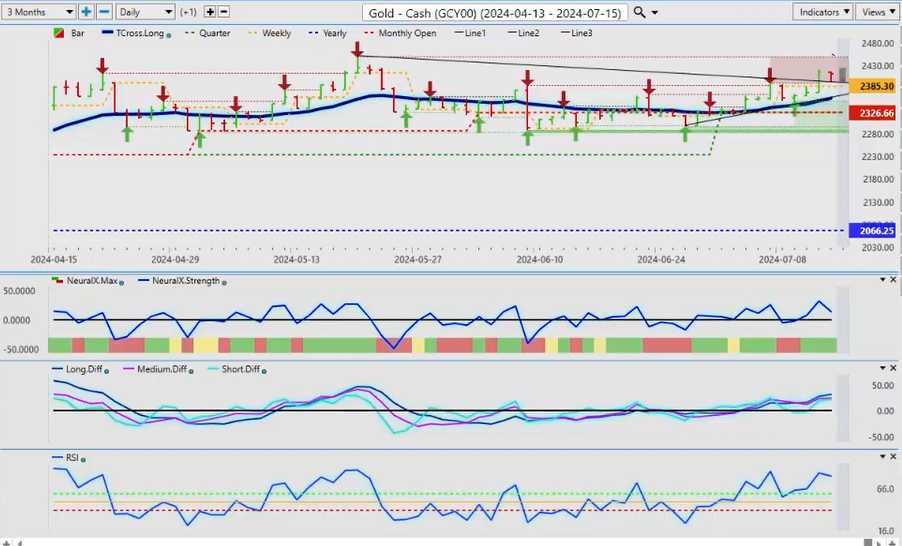
Gold has very easily responded to that dollar weakness, moving higher off of our T cross long. Our key support level for next week will be 2357.92, with our monthly opening price at 2326. We’re long well above that. The structural bias of Gold looks far better than the US Dollar here. The indicators are a little bit mixed, but any corrective moves we can use our F8 and our software to come down to our long predicted level at 2384. So, good buying between 2353 and 2384.
S&P 500 Index
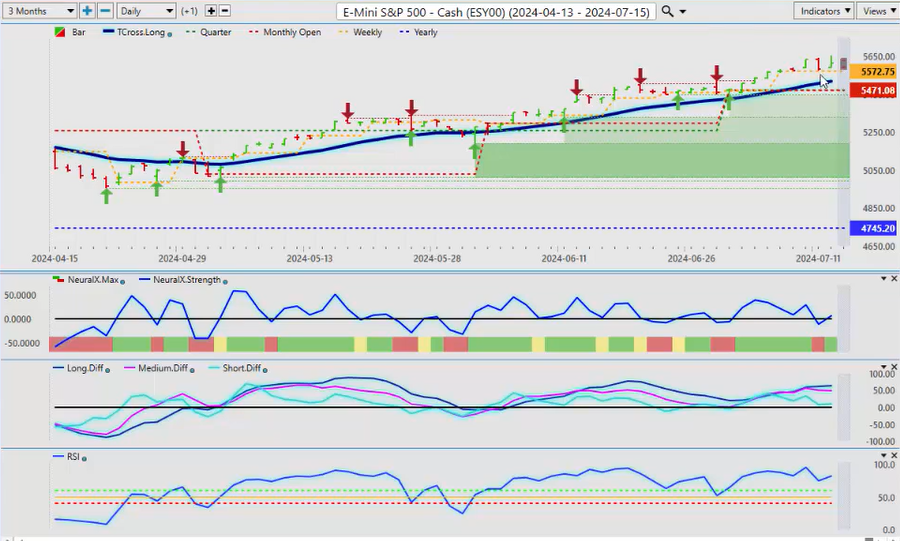
Now, stocks for next week with the S&P are definitely riding the wave off the anticipated Fed rate cuts here. The indicators are still bullish. The MA diff cross is a bit of a concern as we’ve crossed over down, but the predicted RSI is sitting in a good position. Neural index strength looks good, and again the new quarterly opening price is kind of a big area there, guys. 5471 is what we’re looking to hold, preferably above that. Our monthly opening is at 5471.
And again, a very good year so far. We’re sitting at 4745 on the yearly opening price. But nothing goes straight up and nothing goes straight down. We should see some kind of corrective move, but that’s likely going to be contained by the T cross long at 5519. Again, for day traders, we can use our F8. You can see we’re riding every single day. We’re in contact with the VP long predicted, which is in a very good position for Monday’s trading, with the predicted low at 5584. But again, we should be cautious. Even though we are high, it doesn’t mean it can continue.
Bitcoin
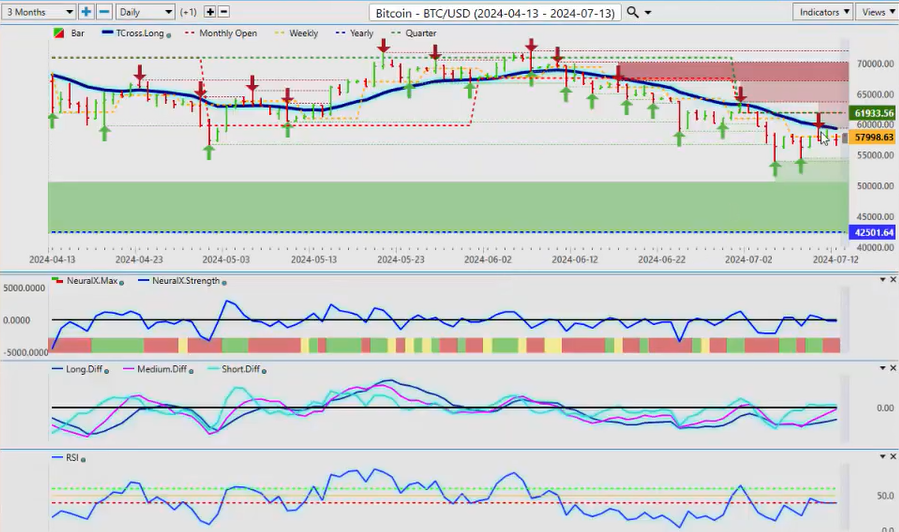
Now, when we look at Bitcoin , a slow buy signal is starting to form here. The only thing stopping the Bitcoin contracts from extending higher is the T cross long, and that current level right now is coming in at about 59,381. Very, very strong support down to about 53,963. We came down this past week to 54 and we saw buying. So again, we can actually put a trend line on this. Very easy to put a trend line on this. We can see if we go like that, we’ve got a downside trend line there. So once again, we’re looking for the TR cross long to break. That’s now 59,381. If we break that, then we can extend higher. That’s the move I would be looking for. But again, we’ve got to get back. A minimum retracement here would be 61933, which is our quarterly opening. Then we would reassess. But again, our MA diff cross is warning us that we are getting ready to go higher. We’ve got a short-term crossover, and a medium-term crossover appears imminent. But the T cross long, again guys, 59381, that’s the level we must break.
DAX
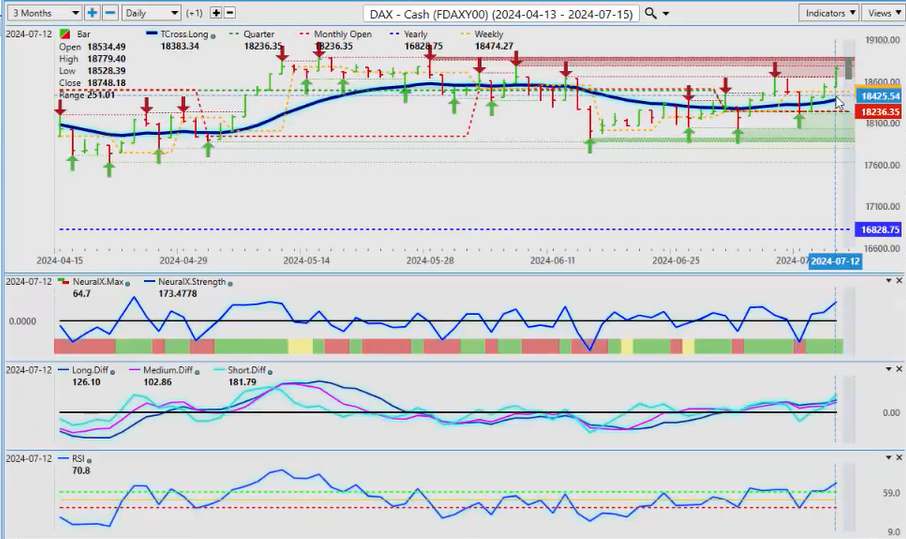
Now, when we look at that in comparison to the European equities, you can see the European equities still doing quite well, extending following the US Equities higher. Everything looks good for the Dax to extend. Very strong resistance up at the 18855 mark. If we can break through there, we can extend higher. But that, in my respectful opinion only, will depend if the US Equities can continue to advance. The indicators do look pretty good, but a retracement certainly could be in the cards. We would keep a very close eye on the VIX to see if we have any signal here that suggests that could happen. We do have an MA diff cross to the upside, but we’re not getting any buying down here. But again, that is something to be concerned with. The additional indicators in VP are suggesting we still have further downside, but it’s a mixed signal here. So be very, very cautious in this coming week.
Euro versus U.S. Dollar
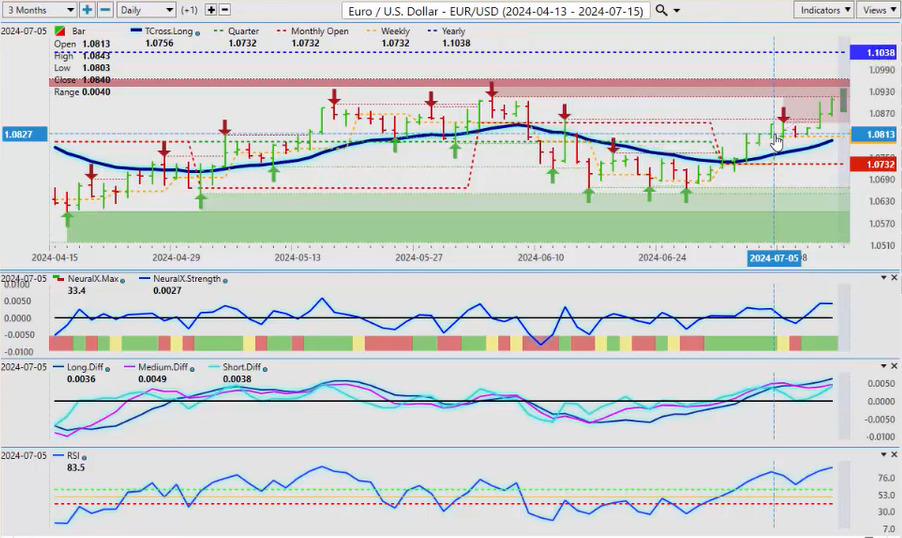
Now, when we look at some of our main Forex pairs, the Euro US, the number one traded Forex pair, once again, we want to avoid the media noise. They said that the Euro would sell off because of the European elections. None of that came to fruition, guys. The inverse correlation between the Euro and the Dollar Index is about 99.9%. So, the Dollar Index down, the Euro goes up, despite what they believe is going to happen with these elections.
When we look at the main indicators, there is some concern here with MA diff cross, but the dollar being under pressure is pushing the Euro higher. 11038 would be our upside target, which is the current yearly opening price that this pair has been below the entire calendar year. We need to break above that area if we’re going to extend higher. That is the area that I would be targeting. But make sure you’re taking profit on the way up here, guys, because again, there are just as many issues in Europe as there are everywhere else. We need to break through that particular level.
But for next week, again, our T cross long is 108. There’s significant support there. If we click on our F8 in our VP software, we get that additional support of the long predicted 108.44. So, for Monday’s low, we’re looking at a pullback to about 108.74. I think we can pull back a little deeper than that and we can reassess because we’ve got 89.3 on the predicted RSI. We do have an MA diff cross to the downside, so the pair could be responding to the softer CPI data. The PPI data was a little bit stronger, but not enough to move the needle on dollar weakness. So again, just be mindful that if we can’t hold this level up here, we could be looking at a deeper retracement to the 107.32 area.
U.S. Dollar versus Swiss Franc
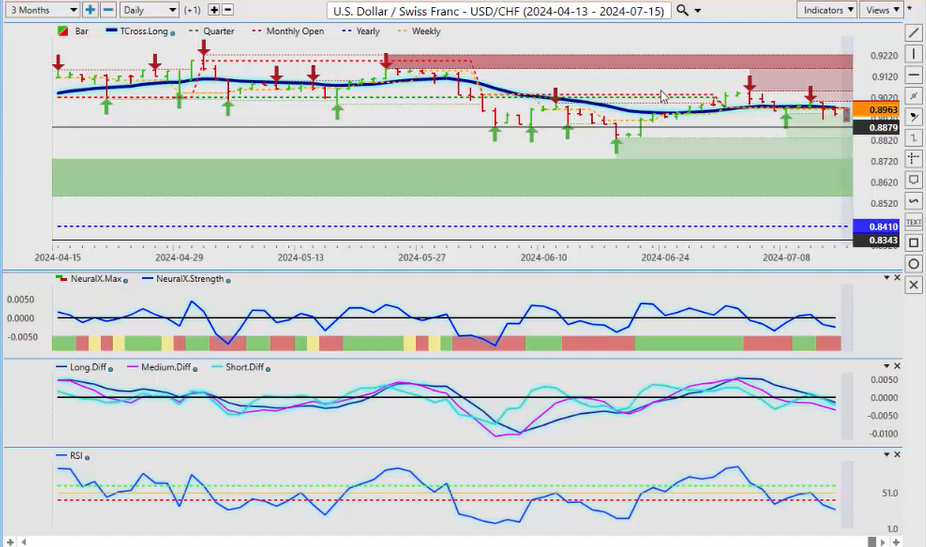
Now, the US Swiss Franc again continues as I had stated last week. We just don’t have any buyers on this particular pair. More money is moving into the Swiss Franc than the dollar for now, potentially for a flight to safety here, but really just sideways action as we move into summer trade. The T cross long is at 8973. We need to break through that level, but as you can see, the predicted differences are all pointing down. We’ve broken the second breach of the 40 level of the predicted RSI, and in most cases, this is a real move to the downside. So, the likelihood that we move lower next week is very, very strong, probably 70 to 80%.
British Pound versus U.S. Dollar
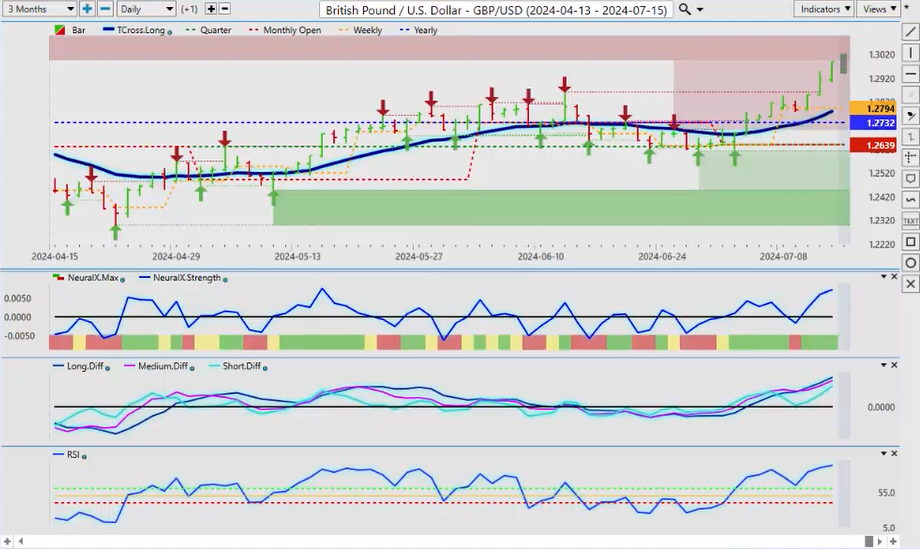
Now, the Pound Dollar has managed to clear its current yearly opening price yet again. But our main area, the one thing that I find very interesting about this, is our T cross long has crossed over our yearly opening price, and in most cases, that’s a pretty bull move. You can see we tried to do that back in early June, late May, but we couldn’t hold it and it went back down. But a very shallow retracement, and we’ve moved up aggressively now. So when we look at this, we always want to make sure we’re backing our VP charts out a little bit to see if we see any other verified resistance. High 12862, there is a level up there. So be a little bit cautious of a bull trap up here. But again, I don’t see any real big recovery in the dollar till probably early September, mid-August. But once again, the market is reacting to that CPI data, and it could be a false break. But right now, the most recent verified resistance high is 12860. We want to make sure we’re holding above that area. When we click on our F8, we can further assess that our long predicted 12868. That’s the area we want to keep an eye on. Very strong close, almost at the 130. It’s been a while since the Pound ‘s been up this high, guys, and I think it has room to extend. A little bit of a concern with that predicted RSI at 92.6, suggesting we could get a pullback, but that would be a buying opportunity if nothing else.
U.S. Dollar versus Japanese Yen
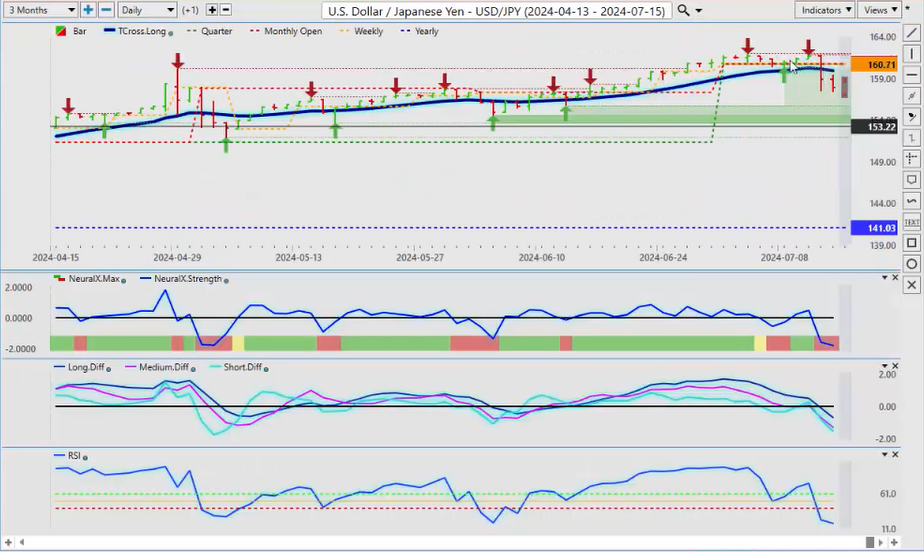
Now, we have a lot of eyes on the Dollar Yen as it’s finally pushing lower. Once again, we talked about this one in last week’s Outlook, that I would anticipate some type of Japan intervention. This is a pretty solid sell signal on this, but guys, this is the carry trade, and you have a lot of traders that do not want to exit this long trade because of the interest rate differential between the Bank of Japan and the Fed. So again, right now, I think our next verified support low is 154.55. We could hit that level very quickly if the market believes the FED is going to have to cut more than once this year. So, July is not really much of a wild card. He could do a cut, but I think it’s very unlikely. September, November, December, I could see a minimum of two cuts, maybe three. But again, if it were me, I would have already cut twice this year based on the data.
U.S. Dollar versus Canadian Dollar
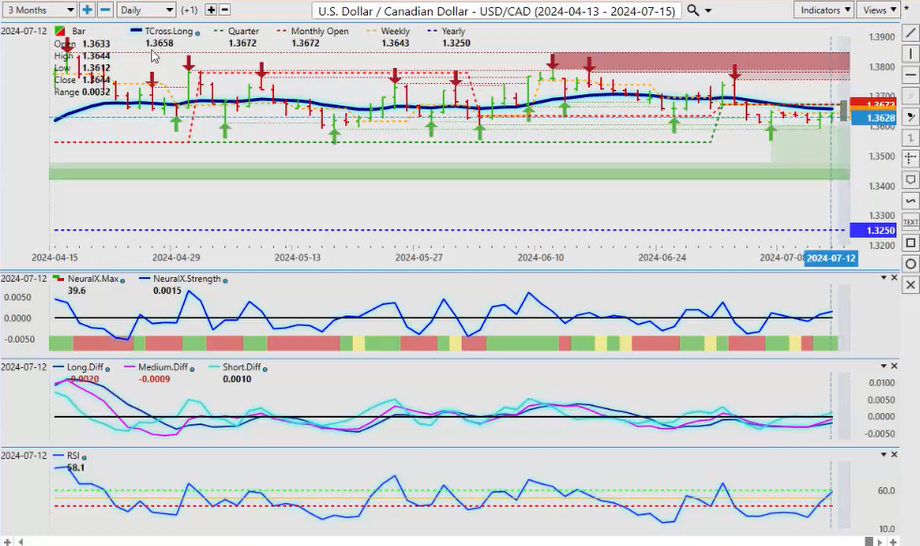
Now, the US Canadian pair again is going to be a tricky week for the Canadian dollar here. We’re just hovering below our T cross long. We’ve got our quarterly opening at 136.72, the monthly matches that, and the yearly is at 132.50. So, in order to move to 132.50, we’ve got to break down out of this area here and make a clean break of it. Now that could be tricky because, again, we want to make sure we’re looking closely at oil.
Light Sweet Crude Oil
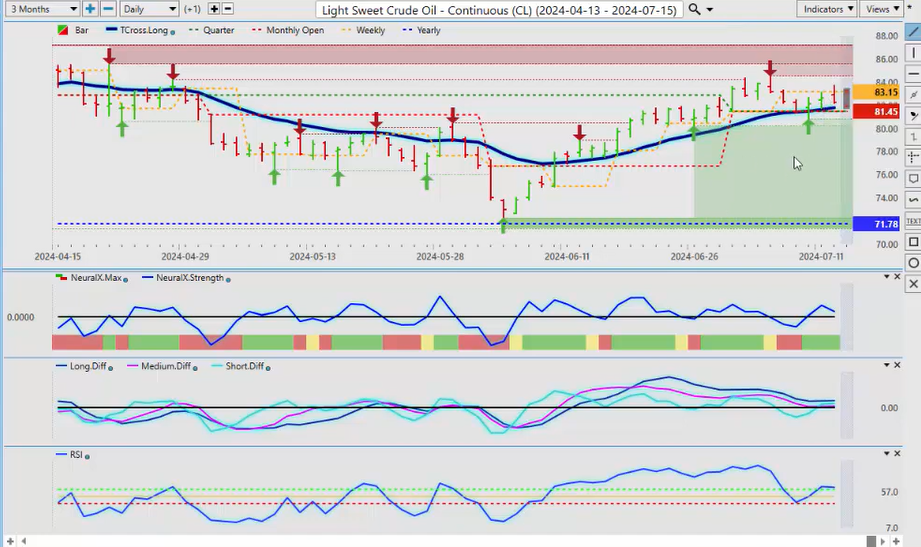
And oil right now again has a very high correlation to the US Canadian pair. So if Crude Oil , which still has a pretty strong signal to it, can move higher, then that would push US Canada towards the 132.50 area in the weeks ahead. So a lot is riding on stocks and oil going high. Commodities in general going higher, and as you can see, there is another buy signal forming on oil right off of RT cross long at 81.75. So in theory, that should put downward pressure on this particular pair. All of our resistance for next week is at 136.72. Any break above that or near that area is likely a pretty decent short. Now our predicted high for Monday with Vantage Point is 136.83, so a significant amount of resistance up there, but a very mixed bag in indicators, guys. The neural index, the neural index strength, and we have an MA diff cross to the upside, but it’s corrective to the upside unless we break through and stay above the 137 area.
Australian Dollar versus U.S. Dollar
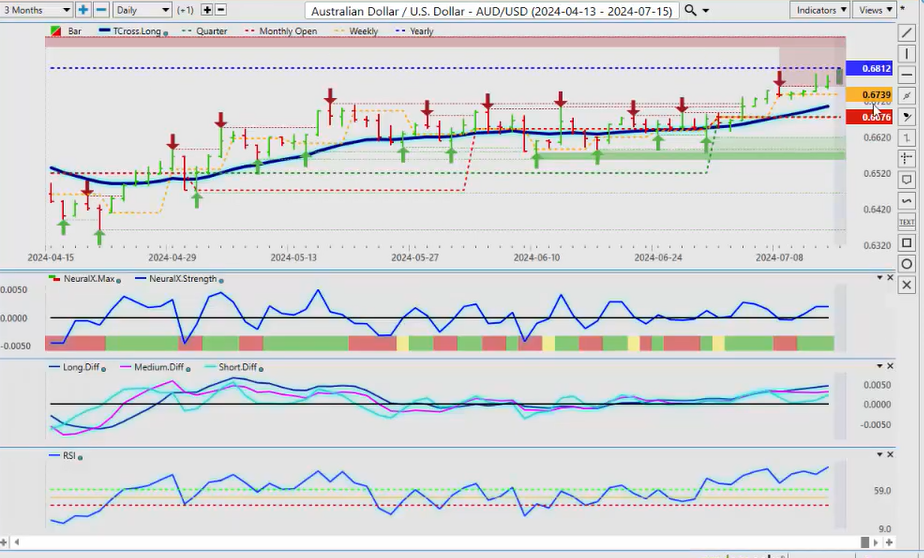
Now, the Aussie is again advancing pretty strong. But once again, guys, this is not subjective; it’s an objective number, 68.12. Yes, the Aussie looks bullish by this chart, but it’s actually still bearish on the year. If it’s going to fail, it will be at 68.12 or just above that area. But if we get above this area, then we have the opportunity for fresh longs, potentially longer-term buys on this particular pair. If we look at it over a 4-year period, you can see that the Aussie is grossly undervalued at this particular level. If we come back further than that and we look back in the 5 to 10 year mark, it wasn’t that long ago where this pair was trading above parity. So again, that’s something to consider and keep your eye on. You can see at 97 cents. So, I think we do have some opportunity here. We just need confirmation. We need to stay above that T cross long and our monthly opening price, but the main thing we need to do is break through that yearly opening price at 68.12 and stay above that, and that would start a new trend. This is why we want to avoid that rolling performance model, guys, because we don’t want to move the goalpost. We want to know if this pair is bullish or bearish on the year. The answer is bearish. It has bullish momentum, but in order for it to actually be bullish on the year, we’ve got to get above 68.12.
New Zealand Dollar versus U.S. Dollar
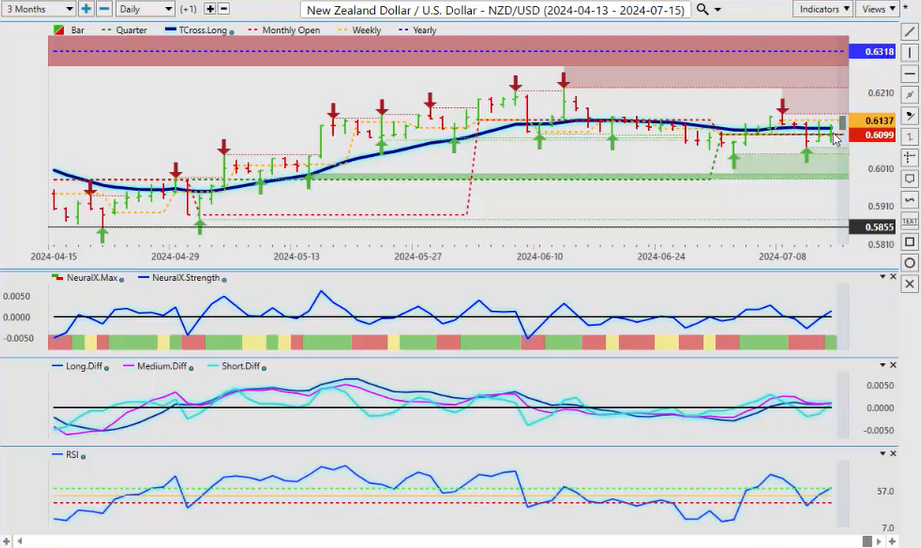
The same thing would apply to the Kiwi here, but the Kiwi , in my respectful opinion only, is better value. And if the Aussie breaks above its yearly opening price, we have a significant gap between where we are in the Kiwi right now and its yearly opening price at 68.18. So, I believe again, this could show up in Australia New Zealand this coming week. When we look at is it possible the Aussie could rise after that data last week? I believe it is possible. We have indicators here that are suggesting there’s weakness forming in the Australia New Zealand pair. So, if that’s the case, that would slightly weaken the Aussie around its yearly opening price and push the New Zealand in US higher. So it very much is like a chess game with some of these pairs and some of the different commodities to understand how they really work.
So with that said, this is the VantagePoint AI Market Outlook for the week of July 15, 2024.