Article Summary: FXCM Trading Volume on the EURGBP showed a lack of endorsement on the recent move to multi-year lows. A lack of endorsement on new lows shows a strong countertrend move is in focus. That brings us to pattern analysis to look at risk: reward in relation to the larger trend, which has been validated by other technical developments. Additionally, w ith SSI showing retail traders building an aggressive short position , sentiment traders are favoring upside .
Talking Points:
- EURGBP trading volume w as muted on 3 attempts at multi-year lows
- Double Bottom Pattern looks to have attractive risk: reward
- EURGBP SSI shows 84% of traders are short favoring further upside off higher low
“ All truth passes through three stages. First, it is ridiculed. Second, it is violently opposed. Third, it is accepted as being self-evident.”
A rthur Schopenhauer, German philosopher (1788 – 1860)
A failure on a chart can easily communicate as much as a confirmed move. Some of the best trades come when a prior held move is invalidated because it isn’t catching the bids it previously had. Such a scenario seems to be playing out cleanly on EURGBP. This failure has brought together a chart pattern, sentiment signal, as well as volume validation of a trade against the prior trend.
The failure on EURGBP brings a clear message for the time being. The message is that the market has little to no interest in additional exposure long GBP and short EUR below 0.7000. The inability for the market to build momentum past this point favors the new move higher. A key way to recognize this lack of momentum is to see whether price and volume are in agreement or disagreement around this level. Because volume dropped when approaching this key zone, we’ll look for a trade set up that favors a new directional bias.
The Multi-Year Downtrend in EURGBP Has Run out of Gas
(Created using Marketscope 2.0 charts )
Complementing sentiment and volume is the technical analysis approach. Technical analysis looks for potentially repeatable patterns that can provide an edge, so long as risk is managed. The chart above shows EURGBP working out a potential double-bottom patter. This is a reversal pattern and should be watched carefully for invalidation.
This article will look at what these circumstances mean for the pair moving forward.
Retail Sentiment is acquired using Plus’ Speculative Sentiment Index. It is free for real FXCM account holders, but is also free for anyone using a two week trial: Plus Trial . Most often, SSI will help you see the beginning of a new trend, which is historically fought by the retail trading crowd.
Retail Volume is available on FXCM’s Trading Station Desktop platform. This free software can be downloaded here and a free demo login can be acquired here . Real Volume is a default indicator that can be added to your charts. Volume is used by Institutional FX traders as well as traders from other markets to understand market participation in a move.
EURGBP trading volume was muted on recent attempt to break 0.7000
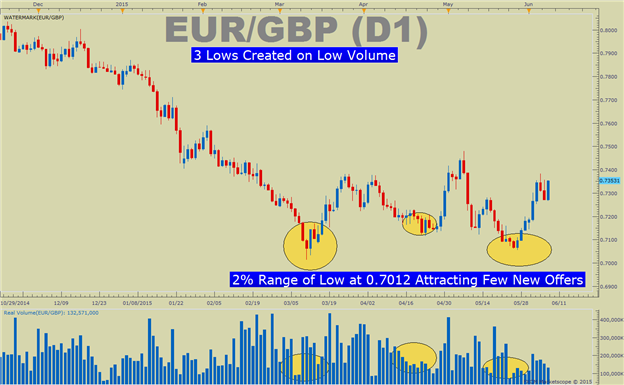
(Created using Marketscope 2.0 charts )
Utilizing FXCM’s real volume indicator has been very helpful for EURGBP traders. The help came in showing that volume was dwindling on the push sub-0.7000. This occurrence happened roughly 3 times from March through late May. Referencing the quote above, this shows a ridiculed thought of EUR moving higher has now become a reality and EURJPY is 1,300 pips of the low and EURUSD moved 1,000 pips off the March low.
Traditionally, traders can look to volume to see what direction price is moving when volume is at its highest.
On the other hand, low volume on extreme moves should make traders doubtful regarding the new trend move. While trends shouldn’t be fought without evidence, a multi-attempt like we see on EURGBP on low volume should put a trend trader on the sideline or looking for short-term opportunities higher. Additionally, traders and can look to prior support levels or pivot points acting as support to hold in order to validate the new trend has some legs.
On the bigger picture, moves against the larger uptrend need to be watched as larger term trends have a tendency to overtake shorter-term discrepancies. On the chart above, you can see how volume came up short within 2% of 0.7000 and we’ve now seen a swift move higher that could favor a double bottom price pattern playing out in favor of the EUR .
In short, traders can look for a follow through higher in price that is matched with volume pushing higher when price moves higher showing volume and price confirmation . A development where price breaks resistance and volume moves higher would complement the idea that the larger trend is resuming.
EURGBP SSI Shows 84 % of Traders Are Short Favoring Resumption Higher
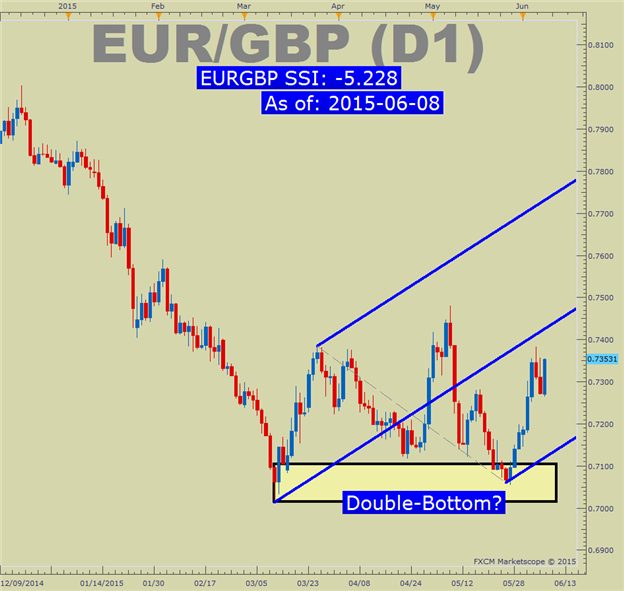
(Created using Marketscope 2.0 charts )
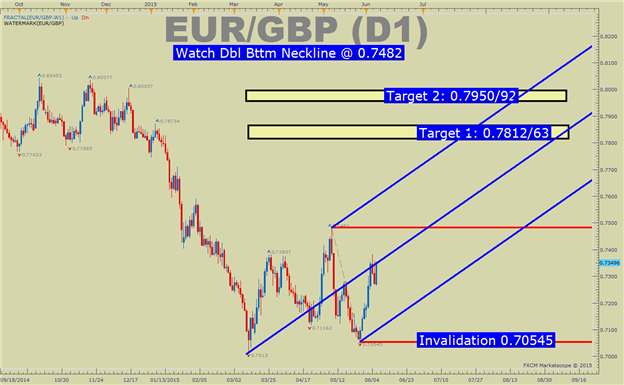
A trader can look to the two recent failed pushes lower to build a bias against. A move near these levels should be expected because nothing moves in a straight line. However, based on the pattern of the move higher since early-March, these levels holding would encourage the view of relatively new highs. The levels mentioned above that could be a Fibonacci based target higher would be 0.7812/63 followed by 0.795092, which would be a full double bottom target with 0.7482 as the neckline for the double bottom.
To help a trader validate the belief of new relative highs, volume can be utilized. Specifically, a trader can look for volume to push above recent highs if the neckline of 0.7482 is broken on the chart. This would validate the view that investors are endorsing the move. Naturally, if price breaks lower though the recent lower high of 0.70545 on increased volume then a trader would likely be better off exiting the trade until clarity develops.
EURGBP SSI Shows a Nearly 6 Times As Many Traders Are Short As Are Long
The Speculative Sentiment Index, or SSI, is a contrarian tool where we look to take trades that are opposite of its reading. So during times when SSI is positive, we would look for sell trades and when SSI is negative, we would look for buy trades. Typically, a reading above 1.5 or below -1.5 are seen as statistically significant and increases the need to be on the watch out for breakouts occurring against retail crowd positioning.
We use our SSI as a contrarian indicator to price action, and the fact that traders are aggressively adding to their shortexposure adds to the potential signal that the EURGBP may resume the shorter-trend higher. You can see in the chart above, the strong downtrend has run out of steam but traders are building up their shorts as per SSI as volume is dropping. This combination has correlated to moves higher. Of course, we will have to see if the bullish view holds on contrarian overwhelming bearish retail sentiment. If the combination holds, it does look like a move higher appears promising.
In Conclusion
Every pair has its own sets of tendencies and patterns. EURGBP did not attract the volume on the test of price extremes sub 0.7000. This displays that traders there were not showing a lot of enthusiasm for the counter trend move that would be needed to carry the pair lower still. The mover higher since the three failed attempts to break 0.7000 has been sharp. Many traders who want to risk this trade may find it best to expect a weak retracement that could give you a better risk: reward.
Thanks to technical analysis, we have a firm shelf of support around 0.70545 to build a bullish bias upon breaking and resistance around 0.7483 to confirm the move higher is resuming as posited above. If the neckline breaks, look further at the Fibonacci targets of 0.618 & 1.00% of the double bottom range to act as price targets.
The sentiment and volume readings are providing signals showing the turn higher could have room to run. Remember however that risk must always be managed in case this does not develop as it has historically. Continue to watch price action, sentiment, and volume to see if the view of a turn higher is validated. Also, feel free to utilize a demo account to practice trading risk-free before trading with real money if you are just starting out.
Happy Trading!
Prior Articles:
Trend Following Components of Ichimoku & Free 3-Part Video Course
AUD Resuming Downtrend Backed by Sentiment & Volume Analysis
USDCAD Symmetry Backed by FX Sentiment & Volume Analysis
Using FX Sentiment & Volume Analysis to Spot USDJPY Trend Resumption
EURJPY New Trend - FX Sentiment & Volume Analysis
---Written by Tyler Yell, Trading Instructor
To contact Tyler, email [email protected]
To be added to Tyler's e-mail distribution list, please click here
Tyler is available on Twitter @ ForexYell
Video Lessons || Free Forex Training
Trading Using Fibonacci (13:08)
Trading With Moving Averages (14:25)
Reading the RSI, Relative Strength Index (13:57)
Money Management Principles (31:44)
Trade Like a Professional Workshop (1:44:14)