Talking Points
-Elliott Wave Theory can provide clues to our location with a trend
- Price action since the 2011 high appears corrective and will likely be completely retraced
- A break below .8659 doesn’t negate a bullish stance, just delays it
To receive future articles via email on trading ideas using equal waves, Elliott waves and triangle patterns, click HERE and enter your email information.
The Aussie has garnered attention lately as its sell off has intensified. Using forex technical analysis and namely Elliott Wave Theory, we analyze two potential wave counts and what the implications are for those patterns.
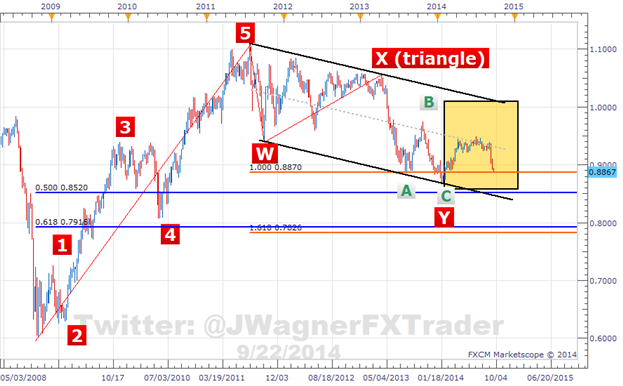
From a longer term perspective, the W-X-Y (red labels) appears to be the favored count. The question becomes, how is the tan box below labeled? There are a couple different ways to count those waves. The charts under the Bearish and Bullish headings focus in on the price action since the red wave Y low in January 2014.
Forex Analysis: AUDUSD Corrective Waves
(Created using FXCM’s Marketscope 2.0 charts)
Bearish AUDUSD
Since the 2011 high, the AUDUSD has been drifting lower with subsequent lower highs and lower lows. A channel formed by the wave 5 - wave X highs and projected from the wave W low has contained prices since the 2011 high.
That is a very nice equal wave pattern down to the wave Y low.
Interestingly enough, prices have had a difficulty in moving above the mid-line of the channel. This suggests overall weakness and a move above the midline would be an early indication of strength.
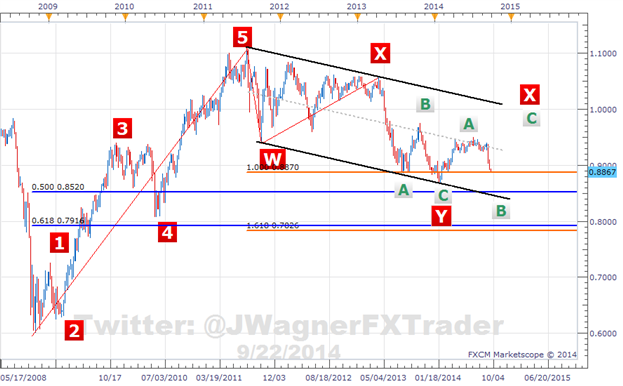
As indicative of the W-X-Y waves, this is a complex correction of the 2008-2011 impulsive move. There are a couple of ways to count out bearish patterns. The nearest bearish target would be the bottom end of the black price channel near .84. The wave labeling assumes a mild push below .86 where as a more aggressive sell off would have an entirely different wave labeling.
Forex Analysis: Short term bearish, medium term bullish waves in AUDUSD
(Created using FXCM’s Marketscope 2.0 charts)
If a more aggressive break takes place, it would likely target the 78 cent - 80 cent zone (not shown). On a break of 86 cents, we can assess the odds of a more aggressive break.
So long as we are below .9200, the bearish potential needs to be respected.
A move above .9200 and the grey midline begins to build the case the bearish count is delayed if not invalid altogether.
Bottom line, a break below the January 2014 low nullifies the bullish count below and suggests a visit towards .84-.85 minimally.
Complex corrections are just that…complex so keep an eye on levels and let breaks of those levels eliminate possibilities.
Suggested Reading: Timing Reversals with Equal Waves
Bullish AUDUSD
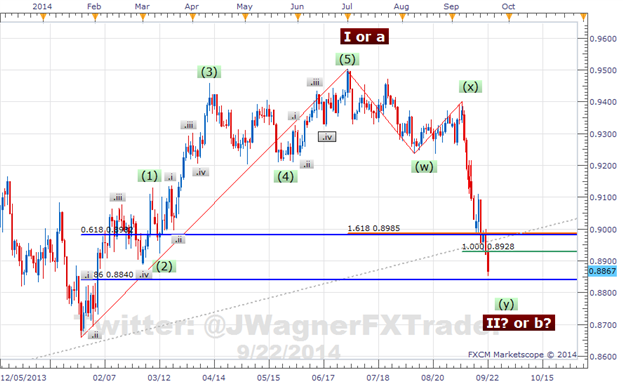
Since January 2014 low, it is possible to count 5 waves higher followed by a 3 wave set back. So long as prices remain above the January 2014 low, this 5-3 wave sequence could be the first building block of a longer term bull run or the first building block of a 3 wave move higher. Either way, the lower AUDUSD maneuvers, the better the risk to reward ratio becomes.
A 5-3 wave sequence typically retraces 50-78% of the original move. The 78.6% retracement level is .8840, so if prices are going to fulfill this pattern, they will need to bounce fairly immediately and preferably before .8840.
Forex Analysis: Short term and medium term bullish AUDUSD
(Created using FXCM’s Marketscope 2.0 charts)
If this bullish case is correct, then moves above .92 will build the case to its validity. If the July 2014 high can be cleared, then the next level of targets becomes .9675.
The risk to this trade can be placed at the .8650 area. If a successful move towards .84 develops, we will reassess the wave relationships to identify potential turning points to enter on.
Conclusion
Bottom line, I have slightly more confidence in the bullish AUDUSD pattern than the bearish side. The 5 wave sequence from the January 2014 low is fairly clear with green waves 1, 3, 5 each subdividing into 5 grey waves. This suggests to me a ‘cleaner’ pattern. As a result, .8659 will likely hold, but even if it fails, a secondary wave pattern (2nd picture above) suggests only a mild sell off towards the 84-85 cent handle.
The cleaner green 5 wave pattern suggests an aggressive sell off is lower probability until .8659 is given.
Good luck!
Recent articles on Fibonacci and Elliott Wave Trading:
EURGBP Looking to Emerge from the Bat Cave
2 Elliott Wave Patterns on Gold
---Written by Jeremy Wagner, Head Trading Instructor, EDU
Add me to your Google + Forex Circle .
Follow me on Twitter at @JWagnerFXTrader .
See Jeremy’s recent articles at his Forex Educators Bio Page .
This article uses Fibonacci ratios to follow a pattern. To learn more about Fibonacci retracement ratios, register and take this free 20 minute on demand course. Register here .