Talking Points
- AUDUSD has been on a downtrend and may continue to push lower.
- Previous levels of Fibonacci support can act as resistance levels
- When one Fibonacci level is broken, price often moves down to the next level of Fibonacci support.
One way traders like shorting after price breaks below a trendline or other significant level of support is to use breakout technique. This involves getting short immediately after price moves through a level of support. However, price oftentimes, retraces to retest the breakout area and traders have to endure time wasted and negative drawdown that comes along with this retrace.
One solution to this issue is to wait until a retrace happens following the initial move. This requires patience on the Forex trader’s part as the thought of missing a big move may outweigh the cool logic of waiting for a better price to short at a higher level. Remember, while bulls look to “buy low and sell high,” bears look to “sell high and buy low.” Therefore, selling at the highest price possible before a drop is the goal. Fibonacci can help us “pick tops” in a downtrend
Learn Forex: AUDUSD Close Below Fibonacci Support
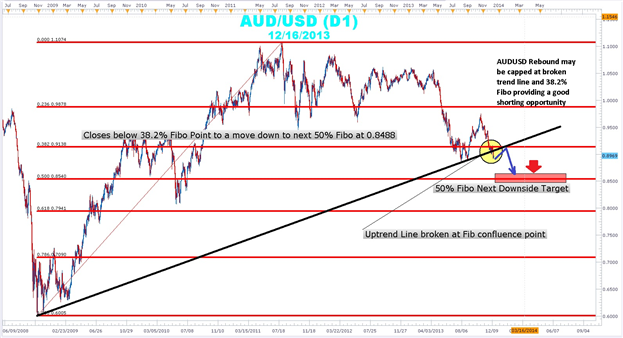
(Created using FXCM’s Marketscope 2.0 charts)
In the chart above, using the AUDUSD 10/27/2008 swing low at 0.6005 and connecting it to the 7/27/2011 swing high of 1.1079 Fibonacci lines were drawn. These lines were tested numerous times while the pair traded in a range. After a level was broken, price moved down to the next level of Fibonacci support. Notice how AUDUSD rebounded from the 23.6% Fibo several times from August 2011 to June 2012.
Next, we saw AUDUSD push down to the 38.2% level at 0.9138 on June 20th. Aussie finally rebounded from this Fibo on 9/5 falling 130 pips short of the 23.6% Fibo at 0.9878; Aussie has been trending down ever since. The 23.6% Fibo of this first set is located at 0.9108 and it could be a possible area to get short. These levels can be used to set profit targets as well as anticipation on entry points.
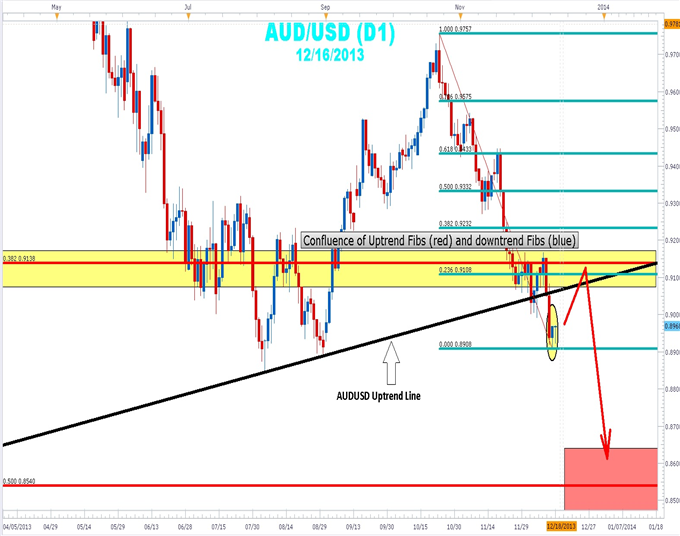
(Created using FXCM’s Marketscope 2.0 charts)
The Trade Setup
The current rebound from the 0.8900 round number support can be used as the ending point of a set of Fibonacci resistance lines starting at 0.9762 (blue lines). The confluence of the trend with the uptrend and downtrend Fibo levels provide a good shorting opportunity. The resumption of the downtrend could see the Aussie moving down almost 600 pips to the 50% Fibonacci level at 0.8540.
The Aussie has not traded at this level since July 2010. Currency pairs have a tendency to overshoot, so waiting for Aussie to turn down from the 23.6% downtrend Fibo level (0.9108) and the 38.2% uptrend Fibo level (0.9138). A stop can be placed above the last swing high once the down trend resumes with a limit of 0.8540.
---Written by Gregory McLeod Trading Instructor
To contact Gregory McLeod, email [email protected] .
To be added to Greg’s e-mail distribution list, please click here.
Follow me on Twitter @gregmcleodtradr.
This article showed you how to use Fibonacci to trade AUDUSD, I want to invite you to enroll in our free Fibonacci Retracement Course to further your understanding of Fibonacci. Sign our Guestbook to gain access to this course that will help you get up to speed on Forex market basics . You can master the material all while earning your completion certificate. Register HERE to start your Forex learning now!