Double tops and bottoms are chart patterns that are quite popular with many traders.
The rationale behind the pattern is that if price action tests the same resistance level twice (double top) or the same support level twice (double bottom) and respects that level both times (in other words does not trade through it), there is the potential that price may continue to move in the opposite direction of the test. That direction being down from a double top and up from a double bottom.
In this trading scenario, a major question becomes how a trader can determine a valid price target or limit for their trade.
Let’s take a look at the chart below which shows a double top pattern…
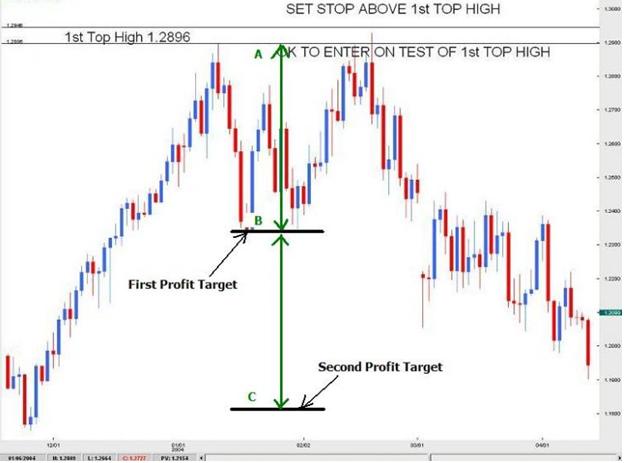
The first profit target will be the distance from our entry at point A to the bottom of the initial retracement at point B. Then, we would take the distance between those two points and add it to what we already have in place and that will give us our second profit target...the distance from B to C.
In trading a double top this way, a trader could elect to scale out of a portion of their position at the first profit target, adjust the stop and then let the remainder trade down to the second profit target.
In trading a double bottom, the above plan would simply be reversed.