Talking Points:
- AUD/USD Trades Lower From New 2017 Highs
- US Dollar Gains Strength on Economic Data
- Looking for additional trade ideas for the Aussie and US Dollar? Read Our Market Forecast
The AUD / USD is turning off of yearly highs, as the US Dollar gains strength on a slew of economic data. From this news, traders should note that this morning’s Philly Fed data reached highs not seen since 1984. Expectations for the event were set at 18.0 but released at an actual reading of 43.3.
Technically the AUD/USD may still be considered in an uptrend after putting in a new 2017 high this morning at .7732. Short term traders should continue to monitor the 10 Day EMA (Exponential Moving Average) found at .7657. This line is currently acting as a point of support, and a decline through this point would suggest a change in the short term trend. If prices fail to breach this average, it may suggest that today’s decline is a retracement in an otherwise up trending market.
AUD/USD, Daily Chart with Averages
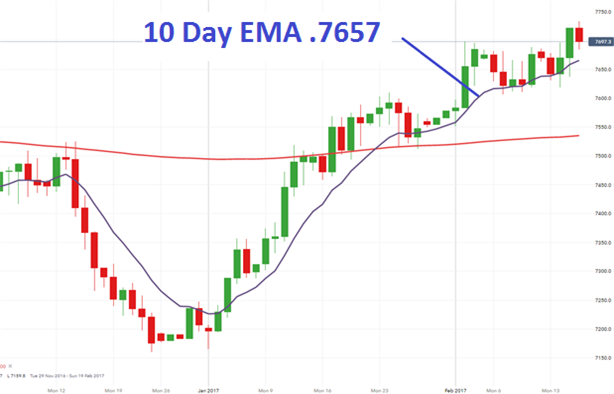
(Created Using IG Charts)
Intraday market analysis has the AUD/USD trading back at today’s central pivot found at .7693. A move through this value would suggest a shift towards bearish market conditions for the session. If prices decline, traders may look for support at the S1 and S2 pivots found at .7664 and .7608 respectfully. In the event that prices rally from present values, first resistance is found at the R1 pivot at .7749. Traders should note that if the AUD/USD reaches this point, the pair would be trading to new yearly highs. Secondary intraday points of resistance include both the R2 and R3 pivots, found at .7778 and .7834.
AUD/USD 30 Minute Chart & Pivots
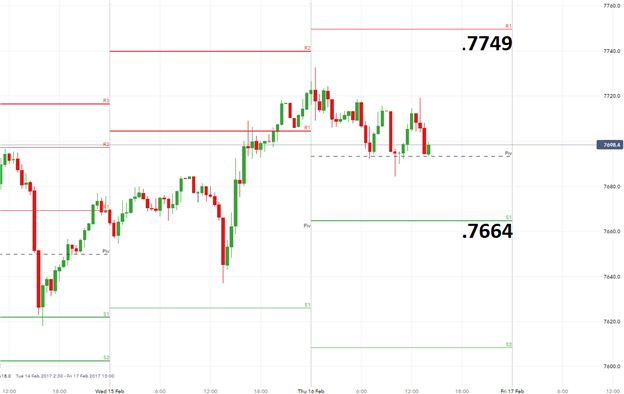
(Created Using IG Charts)
To Receive Walkers’ analysis directly via email, please SIGN UP HERE
See Walker’s most recent articles at his Bio Page .
Contact and Follow Walker on Twitter @WEnglandFX.