Talking Points:
- AUD/USD Trades to Key Daily Support
- Prices Remain Above the 200 MVA for the First Time in 3 Months
- Looking for more trading ideas for the Aussie and the US Dollar ? Read our 2017 Market Forecast
The AUD / USD is finding support this morning after declining for this week’s high of .7609. Much of this morning’s trading has been predicated on US GDP (4Q A) figures being reported worse than expected. Expectations were initially set at 2.2%, but were reported at a disappointing 1.9%. If this news continues to resonate with US Dollar traders, we may see the AUD/USD continue to rise for the remainder of Friday’s session.
Technically the AUD/USD has remained supported above its daily 200 period moving average (MVA). This indicator is now found at .7517, and so far the pair has failed to close below this point during this week’s trading. Short term traders should note that the AUD/USD is also trading back above the 10 period exponential moving average (EMA). Typically the 10 period EMAI is used to judge short term market trends. If the AUD/USD remains above this point, it may be considered a bullish signal. However if prices close below this average and next week’s trading opens lower, it may signal a bearish turn in the AUD/USD.
AUD/USD Daily & Moving Averages
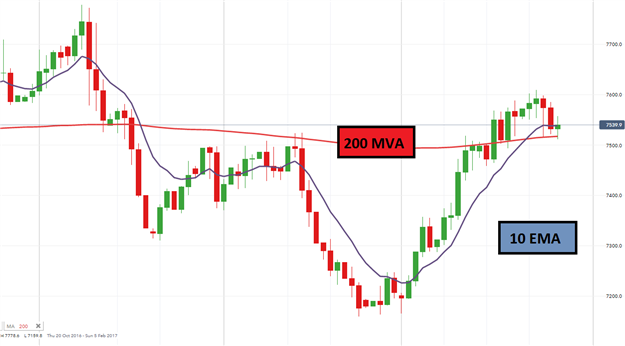
(Created Using IG Charts)
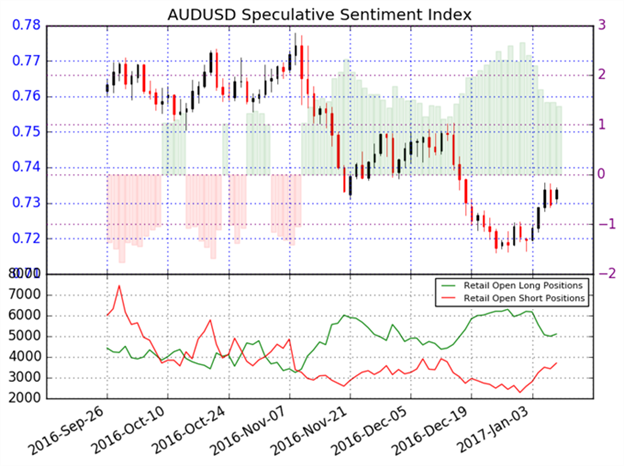
Traders tracking sentiment should note that AUD/USD SSI currently reads at -1.2427. This is slightly more extreme than last Friday’s reading of -1.14. With 55% of participants short the AUD/USD, this reading typically carries a slight bullish bias. If the AUD/USD continues to rebound, and breakout above this week’s high of .7609 it would expected to see SSI values continue to decline. Alternatively, if the AUD/USD breaks down below its major averages, SSI totals may return back to more neutral or positive readings.
How do you read SSI? Learn the basics of the Index HERE .
To Receive Walkers’ analysis directly via email, please SIGN UP HERE
See Walker’s most recent articles at his Bio Page .
Contact and Follow Walker on Twitter @WEnglandFX.