Talking Points:
- Crude Oil Prices React to Employment Data
- An Intraday range has been established: Support $54.11, Resistance $53.40
- Looking for additional trade ideas Crude Oil & Commodities markets? Read our 2017 Market Forecast
Crude oil prices are reacting to a mix of data this morning, leaving it little changed for the session. First up was US Non-Farm Payroll (Dec) figures being released at +156k, missing expectations of +175k. Secondarily was Canada labor figures which estimates that +54k new jobs were added to the Canadian economy.
Technically, Crude oil price remains bullish on the daily chart, with price action remaining well above the 200-day moving average (MVA) which is located at $54.29. However, resistance is still defined by Tuesday’s daily high of $55.21. If a short-term reversal were to begin for Crude Oil, traders would first look for prices to trade back underneath the displayed 10 day exponential moving average (EMA). This point is found at $53.40, and is currently acting as a point of support on the daily graph.
Crude Oil Price, Daily Chart with Averages
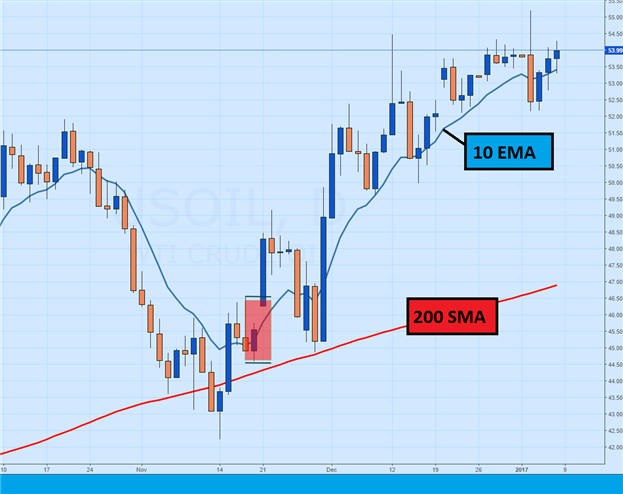
(Created Using TradingView Charts)
Looking for additional trade ideas for Oil and Commodities Markets? Read Our 2017 Market Forecast
Intraday Oil can be seen trading in a clearly defined range. This range begins at the R3 pivot found at $54.11. Prices are currently testing this value for the second time today, after initially declining on the previously mentioned employment data. If prices hold at this value, traders may look for the range to continue, and Oil to decline back towards support at $53.40. It should be noted that prices have held this value of support, after being tested twice so far today.
In the event of a late day breakout, bullish breakouts may be signaled above today’s R4 pivot at $54.47. A move beyond this point should be considered significant, as it would place Crude Oil back within striking distance of this week’s high. Alternatively, bearish breakouts may begin beneath $53.03. A move to this point would be equally as significant as it would place Oil back underneath the previously mentioned 10 day EMA. In this scenario, traders may consider a shift in the short-term trend and use this bias to influence their trading next week.
Crude Oil, 30 Minute Chart with Pivots
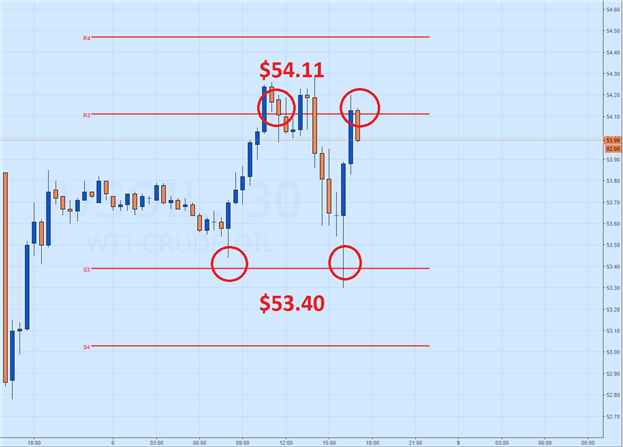
(Created Using TradingView Charts)
To Receive Walkers’ analysis directly via email, please SIGN UP HERE
See Walker’s most recent articles at his Bio Page .
Contact and Follow Walker on Twitter @WEnglandFX.