Talking Points:
- Copper Prices Rally After Retracing From Highs
- Next Resistance is Found Near $2.5929
- A Break Below $2.4210 Suggests a Downtrend Resumption
Copper prices are beginning to rebound, after dropping off from 2016 highs of $2.7333 per pound . Currently the metal is experiencing a 2 day rally which has pushed Copper as high as $2.5709, and back over daily resistance of $2.4930. While this week’s trading is expected to be quite, traders should continue to monitor points of support and resistance to determine if Coppers trend is again picking up momentum.
In the event that Copper prices continue to rally, traders should next look for the metal to test $2.5929. This area is considered a point of technical resistance, and is represented in the graph as the November 14th high. A rally through this point, would then open Copper up to testing psychological points of resistance such as $2.6000 and $2.6500 before challenging standing yearly highs.
Daily Copper with Support & Resistance
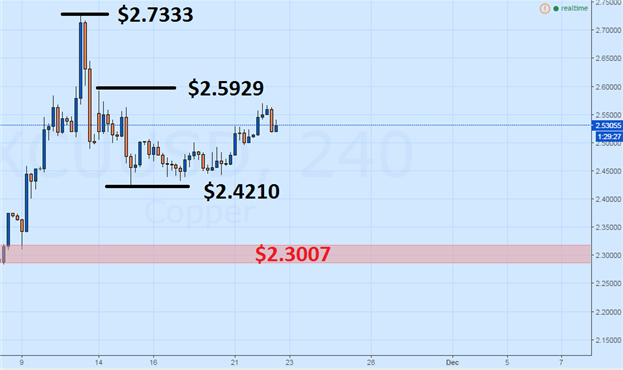
(Created Using TradingView Charts)
In the event that the current rally fades, traders should watch for Copper to turn below today’s standing high. The first value of support that traders should watch for is $2.4432, followed by $2.4210. This last point represents the November 15ht low, and a move beyond this point would suggest that Copper prices are prepared to fall further.
In the event of a bearish reversal, traders should consider that Copper may yet fall back below $2.3007. This area remains a critical swing in the commodities ongoing multiyear downtrend. If Copper trades back below $2.3007, it would suggest that a longer term bearish trading pattern is in development.
To Receive Walkers’ analysis directly via email, please SIGN UP HERE
See Walker’s most recent articles at his Bio Page .
Contact and Follow Walker on Twitter @WEnglandFX.