Talking Points:
- Copper Prices Trade to New Monthly Highs
- Next Resistance For Copper is Found at $2.3252
- Looking for additional trade ideas for commodities markets? Read our Price Forecast
Copper prices continue to rally, trading to a new monthly high this morning at $2.3112 per pound . This move is significant as it places Copper above the previous April 2016 high of $2.3008. Technically, this move may be seen as a continuation of a bullish trendline breakout sustained late in the month of October. Traders should note however, for the current Copper trend to remain intact, price must next exceed the March 2016 high $2.3252. In the event of a bullish breakout above this point, traders may begin looking for Copper prices to rise towards next resistance of $2.4370.
Copper Prices, Daily Chart Range
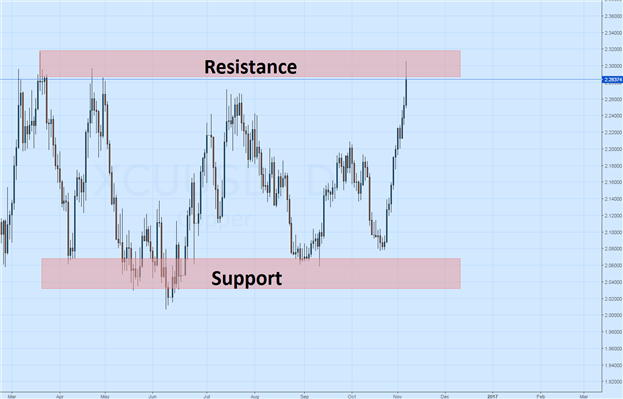
(Created Using TradingView Charts)
If copper prices fail to breakout to new highs, it may suggest that the metal is in a broader consolidating pattern. In this scenario, traders may look for copper to turn near present levels and descend back towards values of daily support. The support zone depicted above include a series of lows near the April 2016 low of $2.0695. In the event that prices trade to support, a bounce in price would again suggest that Copper is consolidating in an ongoing range.
In the event of a turn lower, traders should watch for a bearish breakout below $2.0695. A decline to this point open up Copper prices to retest the June low of $2.0120. Any move in prices beyond this point would expose current yearly lows at 1.9360, and suggest that the commodity is beginning a fresh daily downtrend.
To Receive Walkers’ analysis directly via email, please SIGN UP HERE
See Walker’s most recent articles at his Bio Page .
Contact and Follow Walker on Twitter @WEnglandFX.