Talking Points:
- S&P 500 Bounces from Session Lows
- Daily Resistance is Found at 2,103.42
- Looking for additional trade ideas for equities markets? Read our Stock Market Forecast
The S&P 500 is looking to stem a streak of 7 consecutive daily declines by trading higher for the first session this week. Equities markets remain mixed worldwide however, as traders are digesting yesterday’s FOMC rate decision pared with next Tuesdays election. As such, traders will continue to look at key values of support and resistance to help determine the markets next direction.
S&P 500 , 10 minute
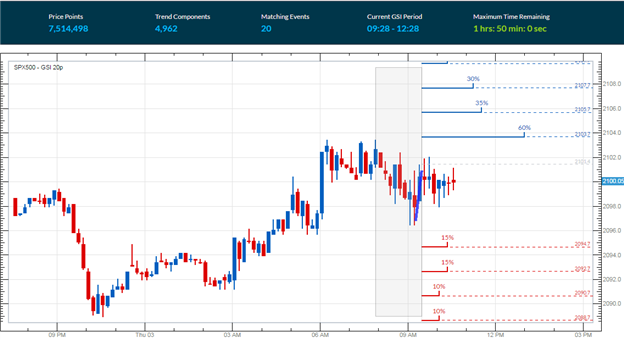
(Created Using TradingView Charts)
In the short run, the S&P 500 can be seen bouncing from daily lows (2,088.67) in the 10 minute chart below. Within this bounce, the Grid Sight Index (GSI) has identified a short term uptrend developing at the beginning of US session trading. Now, after reviewing 7,514,498 pricing points, GSI has indicated that prices have historically continued to advance by $2.30 or more in 60% of the identified 20 matching events. This places the first bullish distribution for the S&P 500 at 2,103.70. A move to this value would place the Index at daily highs, and help cement this morning’s move higher.
Traders looking for a continuation of the current daily downtend should note that GSI has indicated that prices have declined by 6.70 or more in just 15% percent of the 20 identified historical events. A move to 2,094.7 would suggest a return in bearish market momentum, but would also suggest that today’s high of 2,103.42 is now a new lower high in an ongoing downtrend.
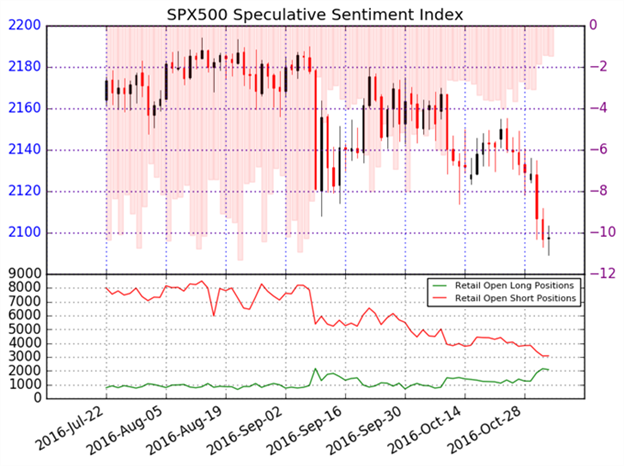
Traders tracking sentiment should note that 60% of traders are currently long the S&P 500. With an SSI reading of -1.48, this is typically seen as a bullish signal. If the S&P 500 continues to rally, this reading would be expected to move towards a negative extreme of -2.00 or more. Alternatively if the S&P 500 continues lower, traders should look for SSI to neutralize from their present readings.
To Receive Walkers’ analysis directly via email, please SIGN UP HERE
See Walker’s most recent articles at his Bio Page .
Contact and Follow Walker on Twitter @WEnglandFX.