Searching For Concise Recommendations That Can Improve Your Trading Skills? Then Our Traits Of Successful Traders Guide Is An Excellent Material For You! Obtain Them HERE
Talking Points:
- USD/NOK respecting support resistance
- Potential USD strength for the cross
- Bounce from resistance on symmetrical triangle pattern
Introduction:
During 2016, USD/NOK registered its all-time high level close to the exchange rate of 9.00 Norwegian Krones per U.S. Dollar . After this event, we have seen USD/NOK consolidate in a symmetrical triangle, registering both, higher lows and lower highs.
Let’s go to the charts so that we can get a better technical perspective of what has been happening with USD/NOK.
Short-Term Technical Outlook:
Analyzing the chart below, we can arrive at the conclusion that during the last month and a half, the technical picture was mainly portrayed by USD weakness. However, during this timeframe, USD/NOK on its search for lower prices faced a strong support between the 8.15 and 8.10 price area. During this past Thursday’s trading session, the cross attempted for the fourth time to break below the above mentioned area, an attempt that failed and placed the cross to bounce with strength back to higher price levels. As of the open of this trading week, USD/NOK continued its journey in search of higher price levels, nonetheless, during London’s session, the cross reached resistance levels delimited by the trend line drawn from the August 18 low and retraced. After retracing from resistance levels, USD/NOK found support at the downward trend line drawn from the July 27 high.
Therefore, by the short-term technical analysis previously mentioned, USD strength should be in the mind of traders, and the upsloping trend line from August 16 should act as a first potential target.
USD/NOK H2 Chart:
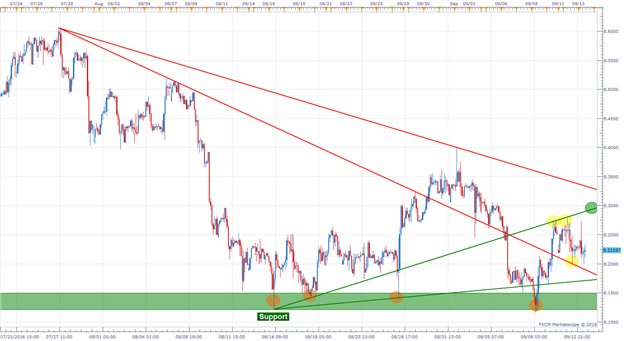
Chart prepared by Quasar Elizundia
Bigger Picture:
USD/NOK D1 Chart:
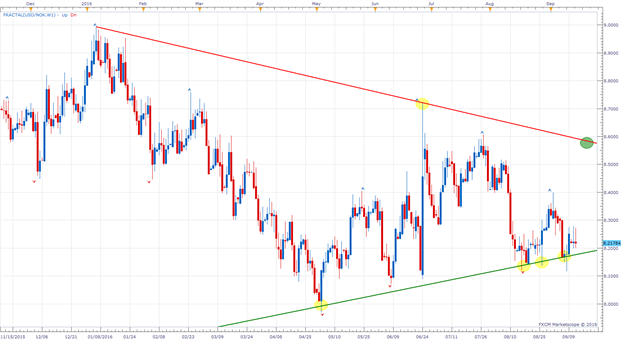
Chart prepared by Quasar Elizundia
As we can observe in the chart above, as we mentioned in the opening paragraph, USD/NOK has been trading in a symmetrical triangle during all of 2016. This triangle is drawn from the January high and the June low of 2016. During last week’s trading action, the cross reached support levels. Therefore, it should be expected that price action now is biased to the upside. However, traders should remain cautious, as price action has reached more times the support line of the above mentioned triangle pattern thus signaling that USD/NOK has been trading with more strength to the downside than compared to the upside.
Bottom Line:
Given that on our short term, the bias is to the upside and the bigger picture aligns with the short-term, traders should aim for potential bullish targets as the resistance trend line drawn from the August 16 low as a first target. In case that USD/NOK has a bullish break above the previously mentioned line, traders should target the resistance trend line from our symmetrical triangle.
However, as we mentioned before, trading action has favored mainly NOK on this pattern, therefore, traders should be cautious with bullish entries. Thus, a good handle of the risk-reward ratio on this trade idea should be crucial. A 1:2 risk-reward ratio should be the minimum consideration.
As an invalidation of this pattern, we would need to see price action to close out of the boundaries of the trend lines. In this scenario, bearish targets now should be in the mind of traders.
Are you interested in knowing what are the Top Trading Opportunities of 2016? CLICK HERE !
Are you a scalper? Then GSI is a tool that could help you on your short-term trades! Check it out HERE
Written by Quasar Elizundia