Talking Points:
- AUD/NZD closing for third consecutive week to the downside
- Short term momentum seems to be exhausting for the cross
- Long term Symmetrical Triangle support line looming
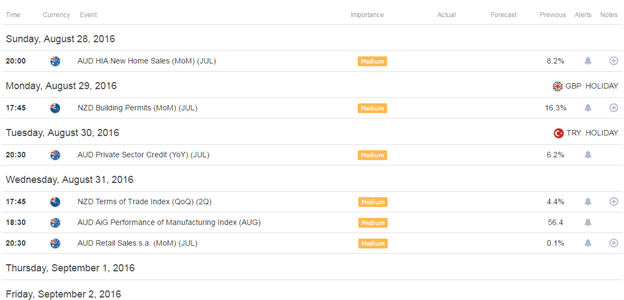
As of Miday Friday, AUD / NZD poses to close for a third consecutive week with a negative reading. Despite the downside continuity of the cross, the rate of change seems to start slowing down as per this week, AUD/NZD has only moved to negative territory by a 0.36% compared to a -1.34% of last week. This performance will likely be maintained, as there are no economic events remaining in the economic agenda for this week that are linked directly to their economies.
Short-Term Technical Outlook:
As how could be observed, over the last past 3 weeks, price action has been taken place mainly within the boundaries of the drawn Andrew’s Pitchfork from the August’s high price level. Despite the strong momentum to the downside the cross has shown over the second half of August, a negative divergence has started to take place between price action and our stochastic indicator. Signal that indicates that strength on this current movement is exhausting.
Therefore, attention should now be turning first to the upper band of our Andrew’s pitchfork channel, and in case the resistance above is broken, the 23.6% Fibonacci retracement from the August 08 high and the Yesterday’s low should be on the radar of traders.
AUD/NZD 1 Hour Chart
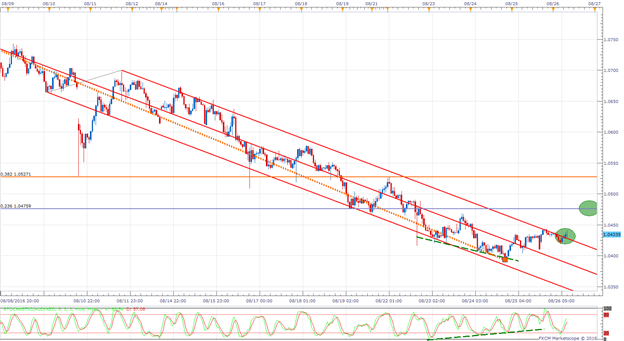
Chart prepared by Quasar Elizundia
Bigger Picture:
If we analyze a daily chart for AUD/NZD, after an intense rally in the first half of August, AUD/NZD found resistance at a price level in which the 233 EMA and at the 38.2% Fibonacci Level coincided. After testing for one extra session this confluence zone, the cross turned to the downside with strength setting good downward momentum. Currently, the downward momentum seems to have stopped as the cross is respecting the 1.04 support price level. The 1.04 price level has worked as great support prior to the cross breaking to the lowest price level on 2016 close to the 1.03 price level.
However, in a bigger picture, price action has been taking place in what we like to call a symmetrical Triangle. The symmetrical triangle pattern in AUD/NZD started its formation in April of 2015. Therefore, given that we are currently trading below the 233 EMA (Bearish Environment), and price action has been confined within the boundaries delimited by this pattern, focus should be on the triangle’s ascending support line.
AUD/NZD Daily Chart
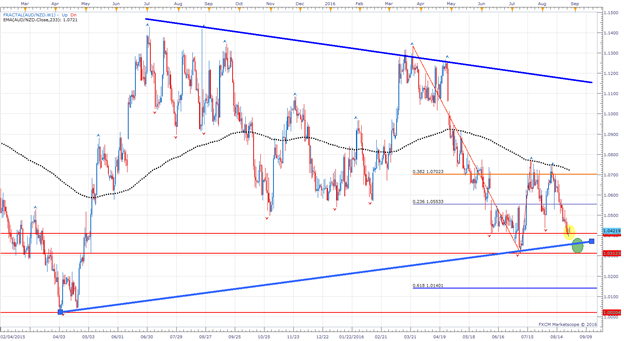
Chart prepared by Quasar Elizundia
Bottom Line:
Momentum seems to be on the side of the bears; this momentum puts in line targets to the downside for traders. Current short-term momentum exhaustion should be taken as positive as this price action could provide a better price entry for traders targeting the bottom line of this Symmetrical Triangle.
In case the scenario above plays to be correct, the next trading scenario traders should start putting together is a rebound from the bottom line targeting higher levels within this symmetrical pattern.
As a contrary perspective, if bearish momentum remains and a break of the pattern takes place, traders should consider short positions targeting the 61.8% Fibonacci Expansion from the 2016 high, 2016 low and the July 2016 correction. As a second price target should be the all-time low of April 2015.
Next Week Economic Fundamentals for AUD/NZD
Are you interested in knowing what are the Top Trading Opportunities of 2016? CLICK HERE !
Are you a scalper? Then GSI is a tool that could help you on your short-term trades! Check it out HERE
Written by Quasar Elizundia