Talking Points
- Gold Prices Continue to Range for 11th Session
- Gold Prices Remain Supported Above $1335.00
- Get the latest analysis on Gold prices with our Q3 Gold Trading Guide .
Gold prices continue to range to start this week’s trading, as prices fail to breakout below critical support at $1,335.00. With prices now bouncing from support, this suggests that the price of gold will close inside of a $20 range for its 11th consecutive session. It should be noted, that if gold prices do bounce here, it opens the commodity up to trade back towards daily resistance at $1,355.00. Traders looking for a breakout will need to continue to patiently wait until the market ultimately breaks in its chosen direction.
Gold Price (Ticker:XAU/ USD ) Daily Chart

Traders watching for short term bearish breakout in today’s trading, should continue to monitor the S4 Camarilla pivot, found at $1,331.64. The price of Gold has already tested this value once, and a close below this value would place the commodity outside of the previously described daily range. Currently, price action is still bouncing from this value. If gold prices rebound back inside of today’s pivot range it opens the commodity up to test intraday values of resistance. This includes the R3 pivot at $1334.06 and the R4 pivot at $1,348.20.
Gold Price (Ticker:XAU/USD) 30 Minute
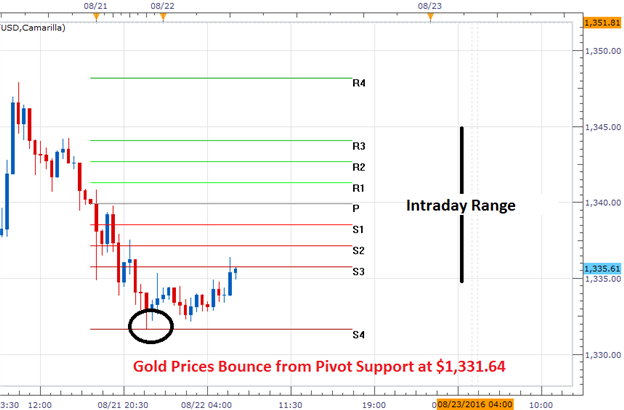
(Created by Walker England)
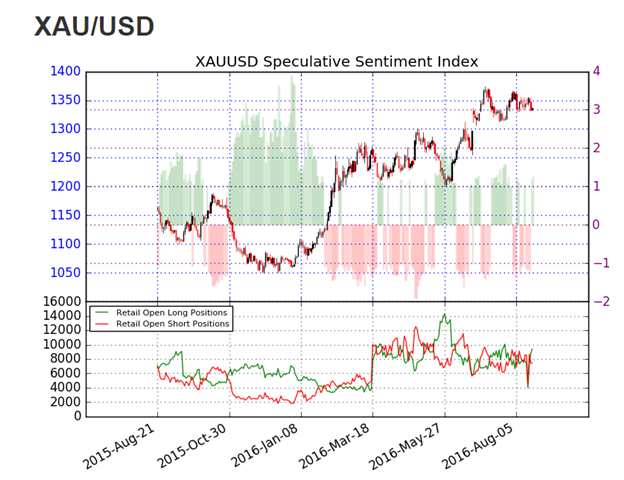
The ratio of long to short positions for Gold (Ticker: XAU/USD) reads at +1.26. This SSI (speculative sentiment index) reading shows that 56% of positioning is currently long. In the absence of an SSI extreme, this neutral value is indicative of the present range bound market conditions. If the price of gold declines below support, it would be expected to see SSI values move to a positive extreme. Alternatively if prices break higher, it would be likely to see SSI flip to a negative reading.
To Receive Walkers’ analysis directly via email, please SIGN UP HERE
See Walker’s most recent articles at his Bio Page .
Contact and Follow Walker on Twitter @WEnglandFX.