Talking Points
- The USD/CAD GDP data releases worse than expected
- Short term momentum is pointed higher, with breakouts above 1.3079
- Bullish distributions start at 1.3083: Bearish reversals signaled at 1.3046
The USD / CAD has surged higher this morning, after an initial decline to daily lows at 1.3017. This movement was predicated on worse than expected Canadian GDP Figures. CAD Quarterly Gross Domestic Product Annualized (1Q) was released at 2.4% which was down from the anticipated 2.8%. Now, short term momentum is headed higher and traders may begin looking for a breakout to a new daily high above 1.3079.
USD/CAD 5Minute GSI Chart
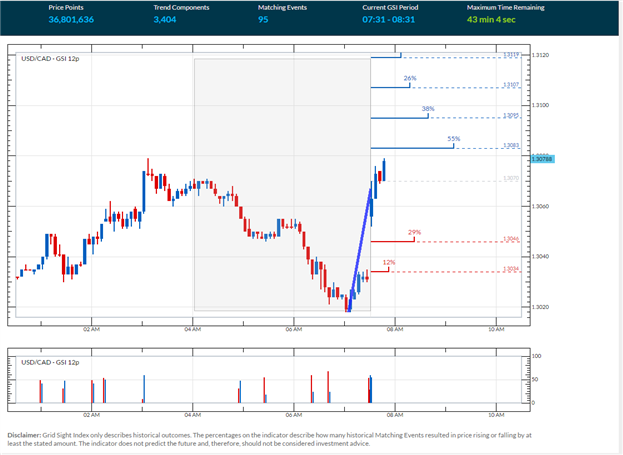
(Created using Grid Sight Index)
Monitor GSI in Real time! Get started HERE.
Traders may see this reversal in price action depicted in the graph above. Recently the GSI indicator has signaled a short term bullish reversal through the creation of a series of short term higher highs. This has been denoted in the graph above by price action moving through three of the previously marked distribution points. If this trend is poised to continue, trader will look for price to move through the next distribution point at 1.3083. After searching 36,801,636 pricing points, GSI has indicated that price action has extended 13 pips in 55% of the 95 matching historical events.
Reversals in momentum would be signaled if the USD/CAD began to decline through 1.3046. It should be noted that prices declined at least 24 pips in 29% of the historical price distributions. In this scenario, traders may begin looking for price action to challenge the lowest distribution point, depicted above at 1.3034. If prices move to this value, traders may look for GSI to signal a new downtrend, and begin targeting a drop to new daily lows under 1.3017.
What is GSI?
Grid Sight Index is a powerful big data indicator that can help you determine whether short-term trends will continue or reverse. GSI takes a snapshot of current price action and uses that to find similar events by studying millions of historical data points. Then it studies those events to show you how often the trend continued or reversed in the past.
To Receive Walkers’ analysis directly via email, please SIGN UP HERE
See Walker’s most recent articles at his Bio Page .
Contact and Follow Walker on Twitter @WEnglandFX.