Talking Points
- Gold Consolidates After a Two-Day Decline
- Bullish Breakouts Began Over $1,228
- SSI Reads at a Neutral -1.08
Gold 30 Minute Chart
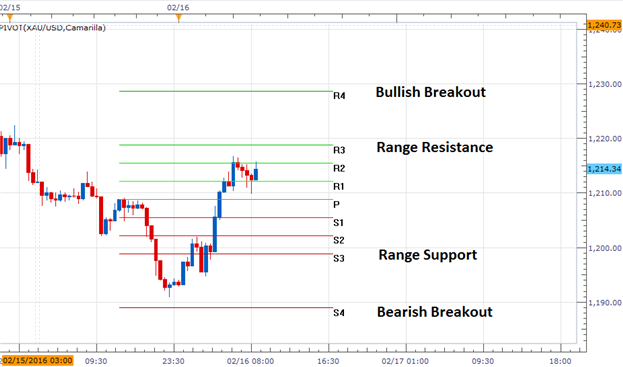
(Created using Marketscope 2.0 Charts)
Losing Money Trading? This Might Be Why.
Gold Prices are ranging this morning, after declining for the last two trading sessions. So far, prices have bounced from support located at the S3 Camarilla pivot near $1,198 and are attempting to rebound towards values of resistance. Today’s value of range resistance is displayed above as the R3 pivot, which is found at a price of $1,218. If prices fail to trade above this point, range traders may begin looking for opportunities to trade Gold back towards support.
If prices continue to rise through range resistance, traders will begin looking for bullish breakouts above $1,228. In this scenario, traders may extrapolate 1-X today’s $20 range to place preliminary bullish targets near $1,248. A move to this point should be taken as a strong bullish signal, and may suggest a resumption of Gold’s primary bullish trend. It should be noted that in the event of a bearish reversal, prices breakouts might be identified below today’s S4 pivot point at $1,188. A decline in price to this value opens up Gold to close lower for the third straight trading session.
SSI ( Speculative Sentiment Index ) for Gold (Ticker XAU/ USD ) is currently reading at a neutral -1.0866. With positioning nearly evenly split, this may be a signal for further consolidation for the metal. If Golds bullish trend resumes, traders would expect SSI reading to continue to decline to a negative extreme.
To Receive Walkers’ analysis directly via email, please SIGN UP HERE
See Walker’s most recent articles at his Bio Page .
Do you know the biggest mistake traders make? More importantly, do you know how to overcome the biggest mistake? Read page 8 of the Traits of Successful Traders Guide to find out [free registration required].
Contact and Follow Walker on Twitter @WEnglandFX .