Talking Points:
- This is an extension in our series on the topic of price action analysis .
- In the Guiding Hand of Price Action, we shared the three primary market conditions .
- In our last piece, we showed you how to trade the range ; in this article, we look at the breakout.
In our last article, we looked at how traders can use price action to analyze and trade ranges in the forex market. In this article, we’re going to look at the exact opposite approach: The Breakout.
The Breakout market condition can be fast, exciting, and dangerous. Breakouts will often accompany news or data announcements as traders rush to price-in newly released information that can see markets break through resistance or plummet through support.
But make no mistake about it: The Breakout can be a dangerous condition to trade; as breaks of support or resistance can be followed by reversals, and these reversals, if left unchecked, can be extremely costly.
In this article, we’re going to show traders how they can look to execute breakout strategies with a watchful eye on risk management.
The Setup
In our last article, we showed you how traders can use price action to find and analyze ranges. When prices meander between support and resistance, we have a range. And there are really just two ways to trade this range…
We can either expect the range to continue; selling when prices get to resistance, buying when prices move down to support. Or we can expect the range to break; which may lead to an extended move or perhaps even a new trend formation.
There are two ways to trade the range
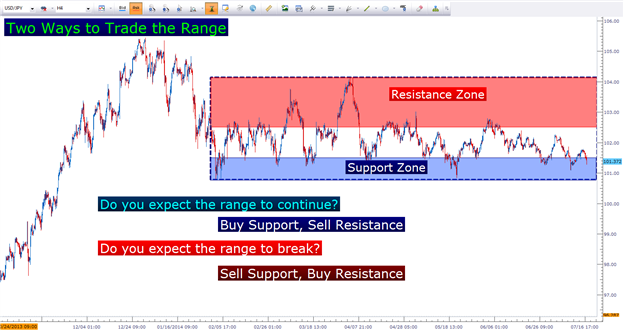
Created with Marketscope/Trading Station II; prepared by James Stanley
The interesting part about the range-bound condition is the messages that price action is sending when this happens….
As we explained in the trend-trading part of this series , new information will usually filter into the market in a progressive fashion. Good news can spark up-trends that will generally display as a series of ‘higher-highs’ and ‘higher-lows.’
There is usually some type of motivation that allows for price to break above resistance in the first place; whether it’s a news report or a data announcement. This is the breakout.
Trading the Breakout
The difficult part about the breakout is the fact that traders are buying new highs and selling new lows. If that motivation that created the break of support or resistance is great enough, we can certainly see the market continue on to make even higher highs or lower lows; but the fact-of-the-matter is that the simple act of breaking support or resistance is an event unto itself – and may bring more buyers or sellers into the other side of the market.
Let’s run through an example…
EURUSD has tested support slightly above 1.3500 multiple times since the early portion of June. Each time has seen an aggressive bounce, highlighting the fact that buyers have been supporting the pair at the 1.3500 price level.
So, traders may be looking to trade the breakout if and when EURUSD falls below 1.3500, bringing more selling orders into the market. But what needs to be of the upmost concern is the fact that the simple act of EURUSD breaking this support level may have a tendency to bring more buyers into the marketplace.
If the news or motivation that proffers a break of this well-found support level is strong enough, sure – we can see prices run all the way to 1.3300 or even 1.3200; but there is no way of knowing that until it actually happens.
These events can be rife with volatility; as this break of support (which is often brought upon by some form of news) can increase activity even more dramatically. This can bring on the possibility of a false breakout that can put the trader in a very uncomfortable position; watching prices reverse as they’d just ‘sold at the low’ or ‘bought the top.’
What Makes Breakouts Work
Because false breakouts can be so common, traders need to account for a higher rate of failure in their strategies. While trend trades have the luxury of a bias in the market (the direction of the trend), and range traders have consistency of well-established support/resistance working for them; breakout traders have neither.
The allure of breakouts is the upside potential: Because if the news or motivation is strong enough, the break can lead to a new trend that might last for weeks, months or maybe even years.
So key to the breakout strategy is aggressive risk-reward ratios; so that even if a trader is only winning 1 out of 3 or 1 out of 4 trades, they stand a chance at profitability. This way, even if the trader catches false breakouts the majority of the time, the instances which prices do continue breaking higher or lower can offset all of those losing trades.
We discuss this type of trade and risk management in the article, The Ballistics of Breakouts .
Entering Breakouts
Trading breakouts is rather objective in the fact that the entry is simply an order to buy above resistance, or an order to sell below support. That’s really it.
Because false breakouts can be so abundant, traders will usually look for ‘strong’ levels of support and resistance in an effort to filter out the less-powerful breaks.
Price action will show you where support or resistance has come into the market in the past, and this can be a great way to validate support and/or resistance levels. We talked about such an approach in the article, Price Action – The Great Validator .
Finding support and resistance levels that have seen price reactions in the past is looking for price levels that have ‘confluence’ between support/resistance analysis .
We mentioned the EURUSD setup earlier, and in the chart below we show you how this level of 1.3500 has come up as a ‘confluent’ support zone. Traders can look to trade the breakout in EURUSD by placing an entry to go short underneath support so that if and only if support is broken the order is enacted.
Confluent zone of support in the 1.3500 zone on EURUSD
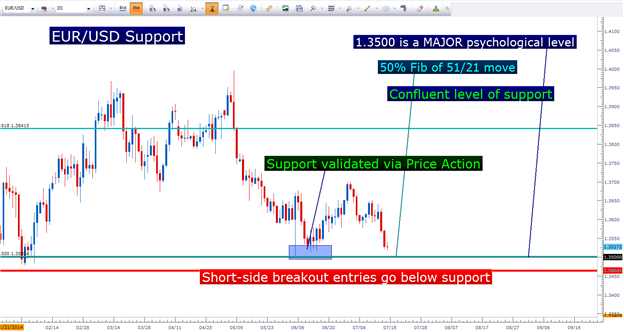
Created with Marketscope/Trading Station II; prepared by James Stanley
The Difficult Aspect of Trading Breakouts
As mentioned earlier, many breakout entries fail. While trend or range traders may be able to focus on a greater than 50% success ratio, breakout traders are usually looking at lower success ratios in the ballpark of 20 or 30%.
So why do so many traders continue to trade this condition?
Well, in those 20 or 30% of instances in which the breakout does continue – the potential reward can be massive.
So to adequately trade breakouts over the long-term, traders should look to adjust their risk-reward ratios to offset this higher rate of failure.
If a trader is expecting to win 20% of the time – they need to look for a minimum of a 1-to-4 risk-to-reward ratio. This way, over a five-trade sequence, the one winner will be able to offset four losers so that our trader can approach break-even.
But we don’t trade in markets to break-even, do we?
So, if the trader looks for a 1-to-5 risk-to-reward ratio, and if they win 20% of the time; they can be seeing a net profit after transaction costs are calculated. The one winner makes up for the four losers in the five-trade sequence; and there is some profit leftover to compensate the trader for their time.
Before employing any of the mentioned methods, traders should first test on a demo account. The demo account is free; features live prices, and can be a phenomenal testing ground for new strategies and methods. Click here to sign up for a free demo account through FXCM.
James is available on Twitter @JStanleyFX
Are you looking to take your trading to the next level? The 3 6 0° Course offers a full curriculum, along with private, weekly webinars in which we walk traders through dynamic market conditions using the education taught in the course.
Would you like to trade alongside seasoned professionals throughout the trading day? On Demand gives you access to Analysts during the most active periods of the trading day.
Would you like to enhance your FX Education? has recently launched University ; which is completely free to any and all traders!
We’ve recently begun to record a series of Forex Videos on a variety of topics. We’d greatly appreciate any feedback or input you might be able to offer on these Forex videos: