Talking Points:
- GBPJPY is reaching historic highs.
- SSI could indicate further bullish moves.
- Long-term Fibonacci outlook could see GBPJPY target 184 or even 200.
It’s been hard to ignore the GBPJPY this week as it’s stormed higher. It recently took out its previous high from January and is currently sitting at a price unseen since October 2008. While many traders are looking at this extreme trying to predict a top by selling, some signs lead me to believe it could continue to move even higher. Today we look at retail sentiment and the Fibonacci retracement on the GBPJPY.
History Does Not Repeat Itself, But It Does Rhyme
The first thing I look at when analyzing a currency pair is its SSI value, the ratio of retail buyers and sellers. We use the SSI as a contrarian tool where we favor taking the position opposite of the retail trading crowd.
GBPJPY’s SSI is very compelling for traders looking to buy GBPJPY, as most retail traders have been net sellers for quite some time. And as of this past week, we have seen a flood of short sellers enter the market moving the SSI into further negative territory. Some may look at this extreme sentiment value and say a ‘top’ in the GBPJPY is imminent, but we have seen this type of sentiment during previous bullish runs. See the historical SSI chart below.
Learn Forex: Technical Analysis - Trend
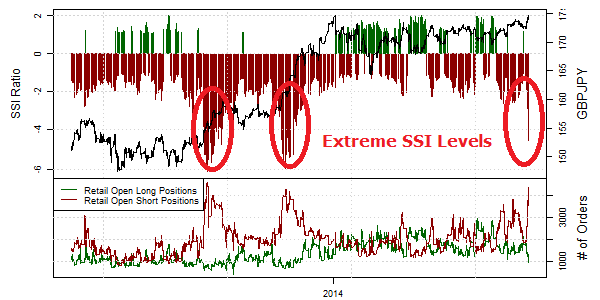
(Copied from .com’s Speculative Sentiment Index Page )
This chart shows 16 months of SSI values with an overlay of GBPJPY’s actual price. The 2nd half of 2013 is what I find particularly interesting. There were two times when SSI reached a value similar to what we see today, September 2013 and November 2013. Each of these moments occurred when GBPJPY was breaking significant highs and then further moved in a upward direction. The power of SSI showed up in spades as buyers really cashed in.
I show these examples not to guarantee that this will happen again, but to show you that historically it has happened and is certainly a possibility to occur again. History does not repeat itself, but it does rhyme.
Long Term Fibonacci Retracement Levels
Fibonacci Retracements are best used when we have a large primary move in one direction, followed by a move back in the opposite direction (called a retracement.) Drawing Fibs from the GBPJPY high in July 2007 to the low in September 2011 creates 3 levels that could act as resistance.
Learn how to use Fibonacci with this free video tutorial.
The first Fib level, 38.2%, was already taken out earlier this year. It was then retested from above before the GBPJPY moved higher.
Learn Forex: Long Term GBPJPY – Fibonacci Retracement
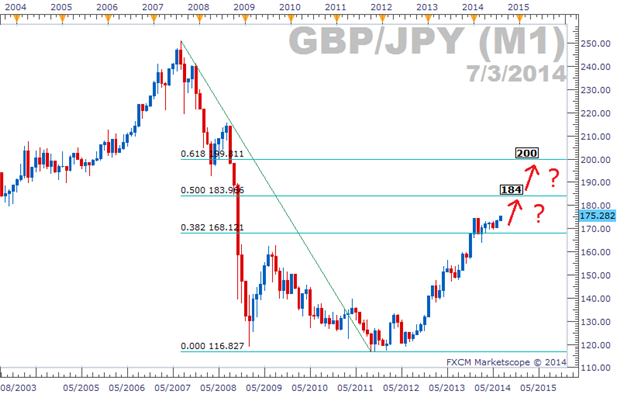
(Created using Marketscope 2.0 Charting Platform )
The second Fib level, 50%, is where we could see the GBPJPY move to if the current rally continues. A GBPJPY exchange rate of ¥184 would be a move close to 900 pips from its current level.
The third major Fib level, 61.8%, would be one of the highest points the GBPJPY could reach and still be considered a “retracement of the primary downtrend.” It sits at the psychologically significant ¥200 level, adding to its power to resist further GBPJPY advances.
Either way, Fibonacci is showing that the GBPJPY could reach much higher levels than where it currently rests.
The Powerful GBPJPY
There is no denying the strength of the GBPJPY lately, but how far will it continue to go? No one knows the future, but trying to call a top might prove painful considering sentiment and Fibonacci levels. If you are interested in analyzing the GBPJPY further, register for a Free Forex Trading account today with live price data.
Good trading!
---Written by Rob Pasche
Ever want a platform that will automatically place trades on your account 24 hours a day? Check out FXCM's Mirror Trader Platform.