Talking Points:
- FX Volatility is at historically low levels
- Range trading strategies tend to work well in low volatility environments
- JW Ranger Strategy can help you time entries on range bound currency pairs
Forex volatility has been slowing down over the past several months. We have seen that low FX volatility is actually very good trading conditions for traders.
Prices typically don’t move fast, but levels of support and resistance tend to hold.
Therefore, if you have found your strategy not producing the amount of wins as expected, it could be that your strategy is a trend loving strategy and the market simply isn’t trending.
Today, I wanted to share with you a strategy that was presented in 2011 and how you can apply it to a range bound environment.

JW Ranger Strategy
The JW Ranger Strategy uses divergence readings on the Commodity Channel Index (CCI) oscillatorrelative as prices move into a support or resistance zone. In essence, we are looking for slowing momentum in price (divergence) coupled with price entering a supply or demand zone which can act as a reason to reverse short term prices.
( To learn more about trading with the CCI, enroll for this free 15 minute course on “Trading with the CCI”. In it, you will learn how to read the oscillator to generate signals. Register for free HERE . )
Divergence into support and resistance is the critical element of the entry trigger on this strategy. The suggested time frame of the trading chart is 15 minute to 1 hour, with my preference being the 1 hour intraday chart.
If you would like to incorporate a portion of your own analysis, that is quite ok because, remember, the critical element is divergence into support or resistance.
Suggested Reading: The JW Ranger Strategy
Learn Forex – USD/JPY Range Strategy
(Created using FXCM’s Trading Station Desktop Charts)
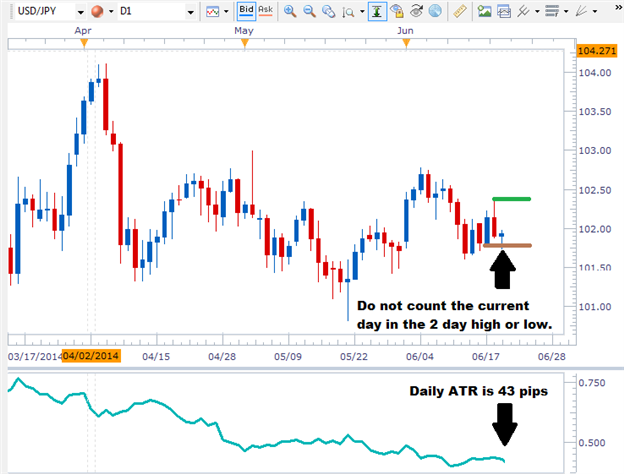
If you are not sure how to identify support and resistance levels, one simple method is to use a 2 day high or low.
On a daily chart, identify the highest high and the lowest low for the past two days, not including the current day.
For example, if today is Thursday, then look for the highest high for Tuesday and Wednesday and note that price on your 1 hour chart. Then, look for the lowest low for Tuesday and Wednesday and note that price on your 1 hour chart.
Note, the current price on the current day, may already be outside that range noted on the 1 hour chart. That is ok; continue to look for entry signals below.
Learn Forex – USD / JPY Intraday Buy
(Created using FXCM’s Trading Station Desktop Charts)
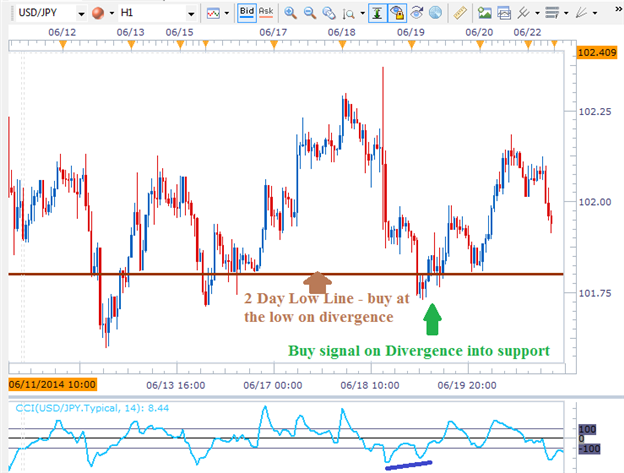
Once your highest high and lowest low are notated on the 1 hour chart, then add the CCI oscillator with a 14 period input value onto the chart.
Once prices have passed above the high level noted, or once prices have passed below the low level noted on the 1 hour chart, then wait for the divergence signal to appear.
Once divergence appears, then we have our entry signal.
The stop loss is set at 50% of the daily ATR value. From the daily chart, you’ll notice the daily ATR is 43 pips. So the stop loss would be half of 22 pips in this case.
The take profit level is set at 50% of the daily ATR value. The take profit level would be the same as the stop loss at 22 pips.
This establishes a 1:1 risk to reward ratio.
With the recent tight range on the USDJPY, it would be a good candidate to trade this strategy. Other currency pairs that are trading in small ranges can be instruments to trade this strategy on as well.
Suggested Reading: ’s 45 page Traits of Successful Traders Guide (free with name, email, and phone number registration)
---Written by Jeremy Wagner, Head Trading Instructor, Education
Subscribe to Jeremy’s email distribution list. By joining, you will receive 2-3 emails per week with trading ideas and forex education articles. We will include follow up to longer term trading ideas as well. To be added to Jeremy’s e-mail distribution list, click HERE and enter your email information.
Add me to your Forex circle on Google Plus . By following me on Google Plus, you will receive chart diagrams with a greater explanation. Additionally, you can ask me questions on forex charts, technical analysis, or trading in general.
Follow me on Twitter at @JWagnerFXTrader .
See Jeremy’s recent articles at his Forex Educators Bio Page .