Talking Points:
- Automated backtesting is fairly efficient, but takes time to test multiple settings.
- Trading Station Desktop’s optimization tool allows multiple backtests simultaneously.
- This saves us time and helps us find strategies that have historically performed better.
Over the past week, we have discussed how to manually backtest strategies using free historical data , and then we explained how to automate the ba c ktesting process to save time . Today’s article takes backtesting one step further when we explain the benefits of automated strategy optimization.
Automated Backtesting Weakness
For those that read the previous two articles in this series, you might be confused on how automated backtesting can be improved upon. After all, it only takes a few moments to run through 1000’s of candles worth of data and see what the results of the strategy are. But, normally we want to try to improve our strategy and refine it, and this can take a surprising amount of time.
Every minor tweak we make to our strategy’s settings requires another run through the backtester and another page of results we need to record and compare. The whole process quickly becomes tedious and is not as efficient as it first appeared.
Learn Forex: Backtesting Strategies, Quick But Tedious
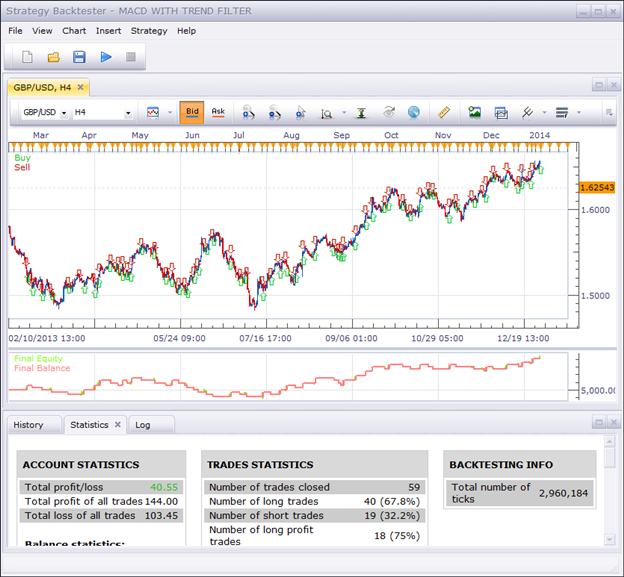
(Screenshot from Backtesting 102 – Free Strategies & Automated Backtesting )
So how can we speed up this process of testing multiple iterations of our strategy? Check out the Trading Station Desktop’s Strategy Optimizer.
Optimizing Strategies Automatically
The Trading Station Strategy Optimizer was designed for us to take a strategy, setup multiple variables for the strategy’s components, and then run one test on the selected price data. All the results for every combination of settings are displayed on a single page to make comparisons simple. Best of all, it saves us a lot of time too.
So how do we start the strategy optimizer and set everything up? We first want to click the strategy optimization button in the top right corner of the Trading Station window. We then can select our strategy. In this example, I will be using the same MACD with Trend Filter strategy we used in Backtesting 102.
Learn Forex: FX Code Base: Custom Strategies
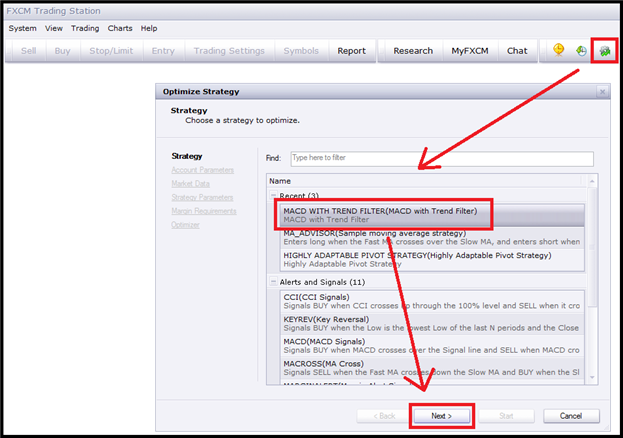
(Created using Trading Station Desktop )
As we progress through the different options, We will notice that it asks the same questions as the Strategy Backtester does (learned in the Backtesting 102 ). But when we get to the Strategy Parameters window, this window will be the main difference.
Rather than setting the Moving Average Periods and the Stop and Limit in Pips, we can now select a range for each parameter. So rather than just testing a Short MA of 100 and a Long MA of 200, we can select a Short MA between 50 and 150 and a Long MA between 200 and 300. The “Step” allows us to select which increment we want to test between the min. and max. values. I set the step to 50 for the Moving Averages in the image below so the Short MAs tested will be 50, 100, and 150, and the Long MAs tested will be 200, 250, and 300.
Learn Forex: Strategy Optimizer’s Parameters Page
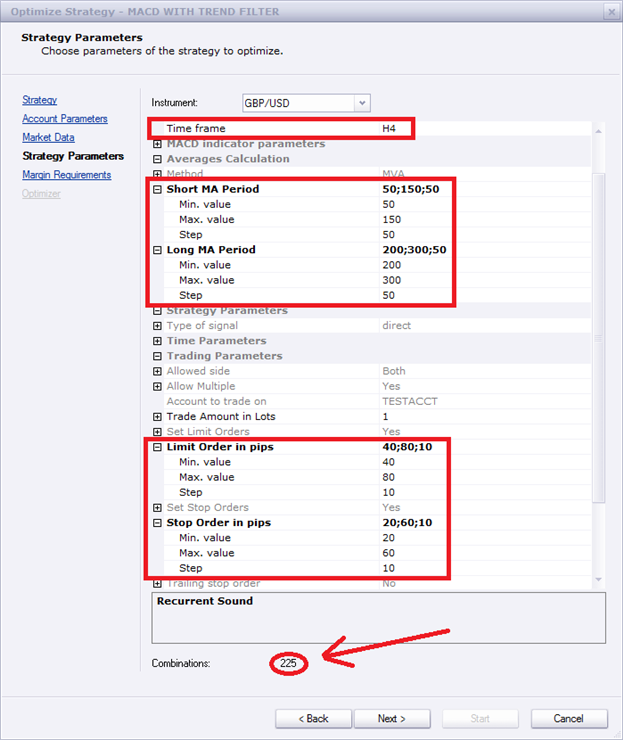
The Stop and Limit are set up to be ranges as well; Limits between 40 and 80 at a 10 pip step (40, 50, 60, 70, and 80) and Stops between 20 and 60 at a 10 pip step (20, 30, 40, 50, and 60).
So the strategy optimizer will test this MACD with Trend Filter strategy using all combinations of Short MAs (50, 100, 150), Long MAs (200, 250, 300), Limits (40, 50, 60, 70, 80), and Stops (20, 30, 40, 50, 60). This comes out to 225 different combinations of the same strategy that will be backtested.
Once we click Start, the Optimization tool will begin to test all of these different settings and will be able to tell us which settings had the best results. It could take several minutes up to several hours depending on how many combinations we have selected and how fast our computer’s processor is.
Learn Forex: Strategy Optimizer Results Window
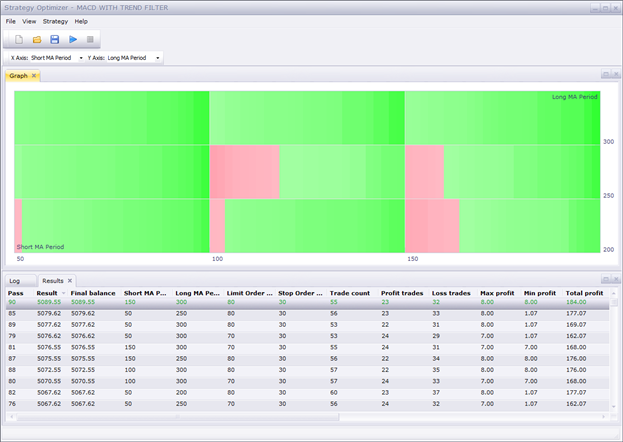
There are two ways the resulting data is displayed once the optimizer has finished. At the bottom is a traditional Excel style spreadsheet with rows and columns, and at the top is a visual display or “heat map” of the different settings with profitable settings in green and unprofitable settings in red. We can see that the best settings for this strategy for the selected data was a Short MA of 150, a Long MA of 300, a Limit set to 80 pips, and a Stop set to 30 pips. These settings provided a gain of $89.55 or 895.5 pips (since the strategy was trading 1 microlot or $0.10/pip)
Opportune Optimizations
Trading Station’s Automated Optimization software is a powerful tool that is completely free to use, but the information it gives us is invaluable. It can quickly tell us the best settings that have worked out historically to help steer us towards a strategy that shows promise for the future. It is definitely worth learning to take your automated trading to the next level. Remember, you can register for a Trading Station demo account for free and have access to this built in software.
Good trading!
---Written by Rob Pasche
Ever wanted a platform that will automatically place trades on your account 24 hours a day? Check out FXCM’s Mirror Trader Platform !