Talking Points:
- Many Forex traders use the Stochastics indicator to find oversold and overbought conditions.
- Stochastics was developed as a divergence indicator by George Lane in the 1950’s.
- GBPUSD has been declining for several days and may be near a bottom.
Many Forex traders lump Stochastics together with other oscillators like RSI and CCI which are used to find overbought and oversold conditions. When a currency pair is oversold, traders look for a buying opportunities while if it is overbought, they look for sell trades.
Though Stochastics can be used to find these overbought and oversold regions, George Lane, the man credited with inventing Stochastics, had a different purpose for the indicator. He noticed that “…momentum changes direction before price.” So he created Stochastics not to follow price or volume. He created Stochastics to follow, “…the speed or momentum of price.”
Find the Trend Direction
Stochastics can help pinpoint entries for buying a dip in an uptrend or for selling a rally in a downtrend. So determining the direction of the trend can increase your trading odds of success. Trading in the direction of the trend also allows traders to only take buy Stochastics signals when the trend is up or sell stochastic signals when the trend is down.
Locate the Correction
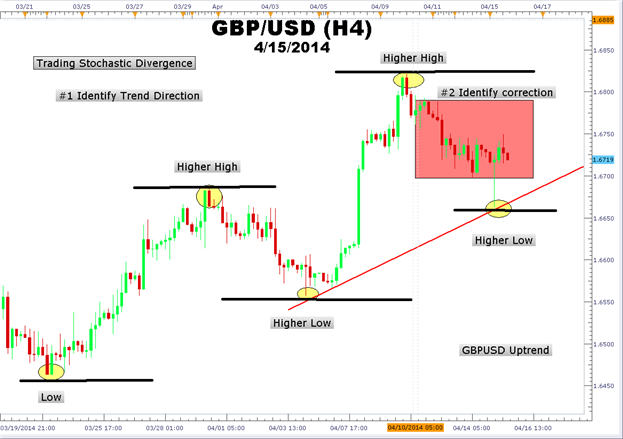
Below we can see an example of a GBPUSD uptrend on a 4-hour chart. Higher swing highs and higher swing lows can be observed from the middle of March to April of this year. After making a high of 1.6819 on 4/9, GBPUSD has been in a corrective decline that accelerated to a low of 1.6655 on 4/15 before rebounding back to 1.6723 the same day.
Learn Forex: GBPUSD 4-Hour Chart Uptrend

(Created with Marketscope 2.0)
Find Extreme Move in Price not Confirmed by Stochastics
Usually, as price move lower, Stochastics moves lower as well. However, if price makes an extreme move lower while Stochastics moves higher, then we have positive divergence. This disagreement between price and Stochastics often foreshadows a price reversal. Before traders can jump on this signal to buy, additional confirmation is needed.
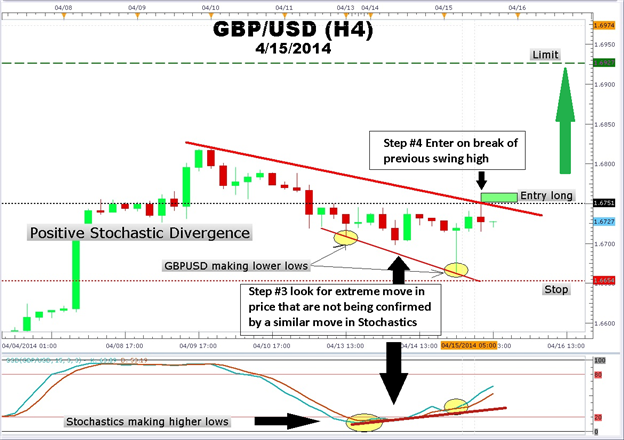
Notice in the example below that the GBPUSD move lower produced a low in the Stochastics indicator confirming strong selling pressure. However, the 4/15 spike lower to 1.6655 was made while Stochastics was trending higher. This disagreement between the Stochastics indicator and price warns us that a reversal is nearby.
Learn Forex: GBPUSD Stochastic Divergence Long Setup

(Created with Marketscope 2.0)
Seek Price Confirmation of Stochastics Divergence Signal
Traders can get long on the break above a previous swing high or prior level of resistance. If GBPUSD is able to close above the red downtrend line and the swing high in the 1.6751 area, we would have confirmation that the divergence signal was valid. If GBPUSD is not able to break and close above the red trend line, then the divergence signal would be invalid and we would move on to another trade.
Manage Risk
Since no strategy can guarantee profits, traders should use stops and limits to minimize risk and maximize profits. Placing a stop below the last swing low is one place to locate a stop. However, due to the length of the wick on the doji Japanese candlestick, traders may want to place a stop at the halfway mark of the candle. A limit that is equal to two times tthe number of pips for the stop could be set
As you are able to identify more Stochastics divergences on charts, you may want to reinforce your learning with practice trades. Use a Free Forex Dem onstration account with FXCM. In this way you can develop your trading skills with the market in real time!
I want to invite you to enroll in our free Fibonacci Retracement Course . Stochastics can be used along with Fibonacci to find turning points in the market. Sign our Guestbook to gain access to this course. You will automatically have universal access to other courses.
---Written by Gregory McLeod Trading Instructor
