Talking Points:
- The Reserve Bank of New Zealand may raise rates 25 basis points at their next meeting
- NZDUSD is at 2014 high after rebounding strongly from a yearly pivot
- Forex yearly pivot pints can show key areas to trade
In this next in a series of articles focused on forex yearly pivot levels, we take a look at how we can apply yearly pivots to trade the New Zealand Dollar versus the US Dollar currency pair. By using these specialized support and resistance levels, forex traders can anticipate probable turning points in price. In addition, forex traders can predict future price targets using these forex yearly pivot levels.
Learn Forex: NZDUSD Weekly Chart with Yearly Pivots
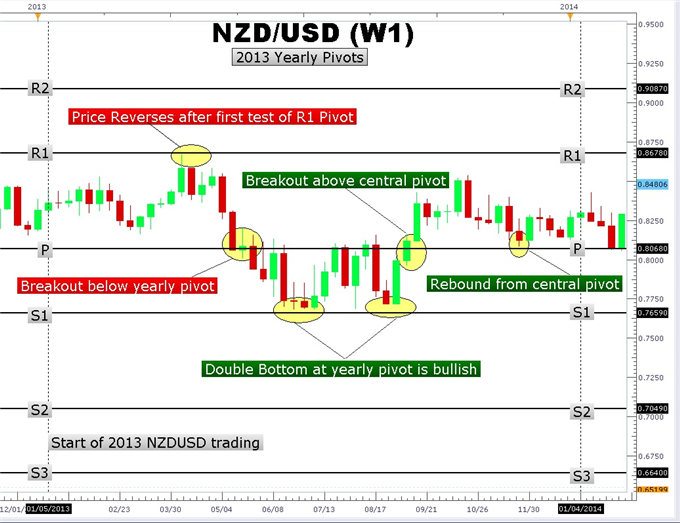
Created with Marketscope 2.0
First of all, let’s take a quick trip back in time to take a look at how forex yearly pivots worked to create an operational trading framework for NZDUSD price action. As 2013 NZDUSD trading got underway, price action was trapped in a fairly tight range for the first three months of the year.
However, in March, NZDUSD staged a rally from a low of 0.8161 up to test the R1 yearly pivot at 0.8678. Failure to close above this yearly pivot led to a subsequent 610-pip decline to the central pivot (P) at 0.8068 in June.
The Kiwi was unable to stage a successful rally from the central pivot. Price broke below the pivot and collapsed another 409-pips down into the area of the S1 pivot at 0.7659. From the yearly S1 pivot, NZDUSD staged a couple of rallies in July and August back to the central pivot forming a very visible double bottom chart.
This double bottom bounce form the S1 pivot led to a powerful 831-pip move into the 0.8500 handle. As you can see, yearly pivots marked the beginning of powerful moves. But could forex history repeat for NZDUSD in 2014?
Learn Forex: NZDUSD 2014 Yearly Pivots
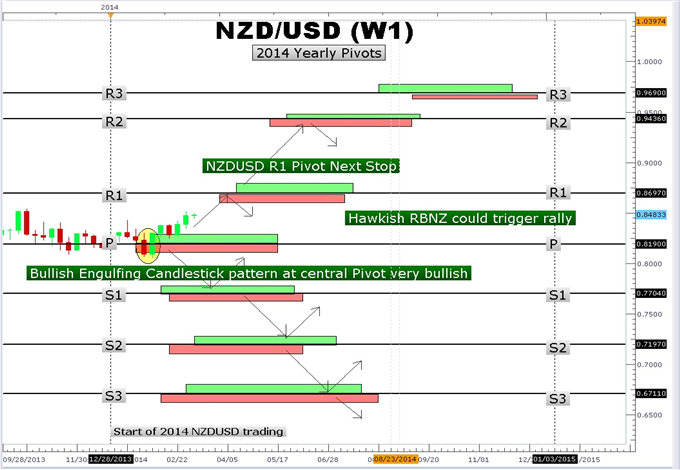
Created with Marketscope 2.0
Unlike 2013 where NZDUSD got off to a slow start before rallying, Kiwi immediately moved down to test the 0.8190 yearly pivot at the start of 2014. After two weeks of trading at the yearly central pivot, NZDUSD broke out with a bullish engulfing candle. NZDUSD has been up trending ever since and currently sits at the 0.8468 area.
This is roughly the midpoint between the R1 pivot at 0.8697 and the central pivot at 0.81900. The bullish engulfing candlestick pattern is a great reversal candlestick pattern. It represents a shift in the overall market sentiment from bearish to bullish. A daily close above the R1 yearly pivot could open a path to 0.9436.
Today at 4:00PM ET the Reserve Bank of New Zealand (RBNZ) coming out with their rate decision . It is widely expected that New Zealand’s central bank will hike rates 25 basis points from 2.50% to 2.75%. This will be the first rate hike since 2010. Investors and traders usually follow yield; NZDUSD could move higher toward the R1 pivot at 0.8697.
On the other hand, if the RBNZ fails to raise rates, we could see a Kiwi sell-off back toward the central pivot at 0.8190. Though Forex traders only put yearly pivots on their charts once, yearly pivots can produce several good trading setups over the course of the year.
---Written by Gregory McLeod Trading Instructor
This article showed you how to identify potential areas of strong support and resistance in the form of yearly pivots. To extend your knowledge take this free interactive video tutorial on the RSI indicator . RSI can be used with pivots to pinpoint entry levels. You will be asked to sign the Guestbook which will give you a Universal Access Pass to other free Forex lessons.
Watch Greg McLeod at 9:30 ET in the + Live Classroom