Talking Points
- Price & Cloud Relationships
- Price Bouncing Off Cloud Shows You A Well-Supported Trend
- An Example Ichimoku Trade with USDJPY
As long as a stock is acting right, and the market is right, do not be in a hurry to take a profit. You know you are right, because if you were not, you would have no profit at all. Let it ride and ride along with it. It may grow into a very large profit, and as long as the “action of the market does not give you any cause to worry”, have the courage of your convictions and stay with it.
-Jesse Livermore, Reminiscences of a Stock Operator
Ichimoku is a trend following indicator that almost anyone can learn to use with ease. When trading with Ichimoku, you’re often advised to start with the cloud to get a feel for whether or not price is trending up or down to past points on the chart. However, to get a better feel for the strength of the trend, it is better to see how price is reacting to the cloud rather than only looking where price is in relation to the cloud at any point in time.
Price & Cloud Interactions
Learn Forex: USDJPY Has Demonstrated a Strong Trend Due To Multiple Cloud Bounces
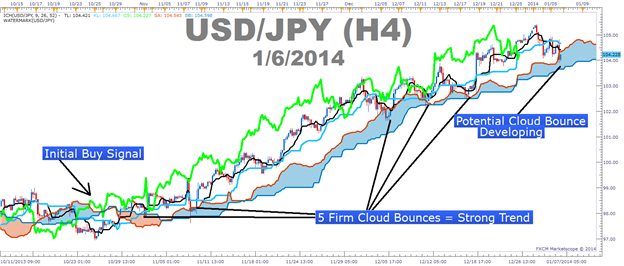
The cloud is a dynamic indicator that takes into consideration two aspects of a currency pair. In an uptrend, the top line of the cloud, traditionally known as Senkou Span A is composed of the mid-point between the 9 & 26 moving average based on mid- prices , or Tenkan-Sen & Kijun-Sen, and pushed forward 26-periods in order to give you a reference for the strength of a move. If current price is above the cloud, then current price is stronger than the mid-point of the 9 & 26 moving average from 26-periods ago, identifying the strength of the current trend.
The cloud’s bottom line in an uptrend, traditionally known as Senkou Span B, is composed of the mid-point over the last 52-periods on the chart and is also pushed forward 26-periods just like the top line. Therefore, if the current candle is above the cloud, which was created from 26-periods ago, then you can see that price is above both the mid-point of the 9 & 26 moving average as well as the mid-point over the last 52-sessions. During the live Ichimoku webinars in the Plus classroom, I often mention that the second line is similar to having a 50% Fibonacci retracement line constantly updating on the chart which can help you see the strength of the current move.
Learn Forex: AUDNZD Displays Price’s Consistent Respect of the Falling Cloud
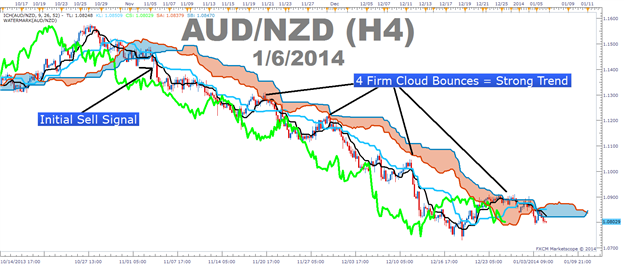
The above example was in case of an uptrend. Because Ichimoku is a dynamic indicator, the order of the lines is reversed in a downtrend. Therefore, Senkou Span A becomes the lower of the 2-lines with Senkou Span B on top. In the picture above, you can see the cloud has turned from blue to orange showing you that the AUDNZD trend is currently pushing to the downside and the cloud is now acting as resistance where it was acting as support on USDJPY above.
Price Bouncing Off Cloud Shows You a Well-Supported Trend
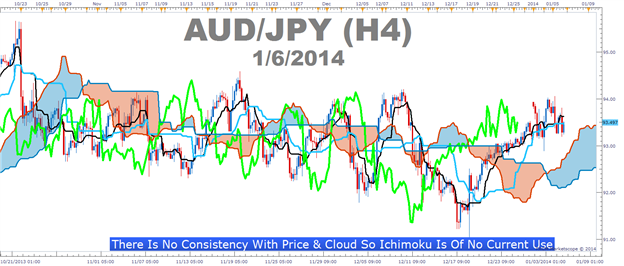
The key point of this article is that it’s not enough to simply know where price is in relation to the cloud to have a strong trend based trade. What you need to do is see if price is consistently on one side of the cloud or if price flips on either side of the cloud showing a very weak or non-existent trend. If there is no consistency with price and is consistently bouncing higher off the cloud proving the cloud as support and that the uptrend is strong, then it is best to take Ichimoku off your charts as Ichimoku doesn’t work well in ranges and will likely only clog up the charts if there is no clear trend.
Learn Forex: Ichimoku Only Helps When There Is Consistency Of Price & Cloud Relationship
A Cloud & Price Example Trade with USDJPY
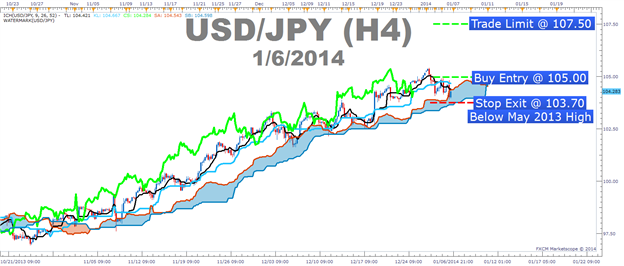
Entry to Buy: 1 05.00 (Breakout through resistance)
Stop: 1 03.70 ( recent price action low and below May 2013 High – Pivotal Support )
Limit: 1 07.50 ( Monthly R2 Pivot )
If this is your first reading of the Ichimoku report, here is a definitive guide on the versatile indicator:
-Full Candle Bodies above the Kumo Cloud
-The trigger line (black) is above the base line (light blue) or is crossing below
-Lagging line is above price action from 26 periods ago (Bright green line)
-Kumo ahead of price is bullish and rising (blue cloud = bullish Kumo)
The purpose of this article was to help you scan for trends that have been respecting the cloud. USDJPY has continually bounced off the 4-hour chart since it broke out of the wedge that started off the May 2013 high. Of course, the trend may reverse and as you learned in the truth of trading , what you’re really searching for is an objective edge like a confirmed trend and a key idea as to when you should exit the trade and Ichimoku can help you with that.
Happy Trading!
---Written by Tyler Yell, Trading Instructor
Tyler is available on Twitter @ForexYell
To be added to Tyler’s e-mail distribution list, please click here
Take this free 20 minute “Price Action - Candlesticks” course presented by Education . In the course, you will learn about the basics of price action and how to use the clues the market is providing to place trades.
Register HERE to start your FOREX learning now!