Talking Points:
- Traders should look to employ a complete approach when trading in any market
- Traders should focus their strategies on appropriate market conditions
- In this article, we give three strategies for the three most prominent conditions
Traders have an affinity for entering positions. After all, that’s what we as traders are here for, right? To place trades?
But with time and experience comes the realization that placing the right trades is much more important than placing just any trade. And this is because our failures in markets actually cost us money. As famed speculator Jesse Livermore said in Reminiscences of a Stock Operator:
“After spending many years in Wall Street and after making a losing millions of dollars I want to tell you this: It was never my thinking that made the big money for me. It was always my sitting.”
Livermore realized what many professionals operating today know: That the entry into the trade is but a small part of the overall approach. Often more important is focusing the strategy on the correct market condition, much like we looked at in the article series, How to Build a Trading Strategy .
More important than finding a set of indicators that might work together some of the time is focusing the right strategy on the right market, managing the risk, and further managing the trade efficiently, and maintaining a strong trading psychology. We talk about risk management and psychology heavily in the article, The Complete Trading Approach .
In this article, we’re going to look at the strategy itself; and rather than looking at or for something to be a ‘holy grail,’ we’re going to look at three different strategies for three different market conditions, so that when you identify a condition such as a trend, range, or breakout – you’ll have a strategy to address that specific market.
The importance of matching the strategy to the market environment
One of the biggest determinants of a strategies success is whether or not the strategy is being applied in the correct market. This was a key study undertaken as part of the Traits of Successful Traders series . In the second part of the series, David Rodriguez looked at a very simple strategy using RSI entries. David looked at long entries when RSI crossed 30 on the 15 minute chart, and short entries when RSI came down and through 70.
As you might imagine, the strategy didn’t fare too well (shown in red in the below graphic). He then applied a time-filter so that the RSI strategy could only trade in the Asian trading session ; a time when range-bound market conditions can be predominant. This entirely changed the success of the strategy. The time-filtered RSI strategy is shown in gold below:
Focusing a strategy on the optimal market can make a world of difference
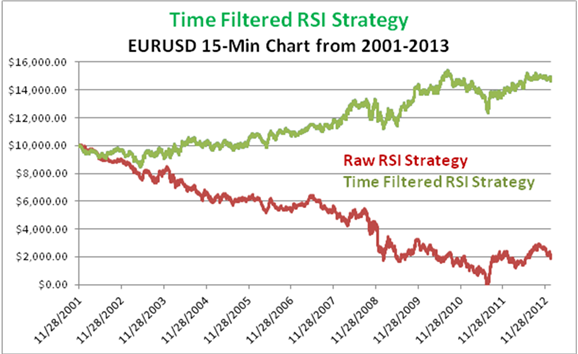
Taken from The Best Time of Day to Trade Forex , by David Rodriguez
This is but one example of the impact that can be had simply from focusing the strategy, even if it’s a very simple strategy using just RSI.
But we can extrapolate this to include numerous time frames, currency pairs, or asset classes.
Traders can look to whatever market they’re analyzing to attempt to identify the current market condition; and then look to implement the strategy that is most optimal for that condition. Below are strategies for each of the three major market conditions.
Trends
Of the three major market conditions, trends are probably the most attractive to the biggest number of traders. The reasons are logical; if there is a general bias on the chart, we can look to simply ‘buy low, and sell high.’
This allows the traders to enter with lower-risk amounts; and if that bias that’s been seen can continue, then the trader can be looking at a very strong risk-reward ratio. If the trend is strong enough, the trader might be able to hang in the position and get a far larger profit target than originally anticipated.
This strategy uses two very common indicators: A 200 period moving average , combined with MACD .
Traders can use the 200 period moving average as a filter to define the trend, so that if prices are above the moving average only long positions are entertained; and if prices are below the 200 period moving average, the trend is classified as being ‘down,’ and only short positions are entertained.
Once the trend has been identified, traders can then look for entries with the MACD indicator. This strategy uses slightly different inputs for MACD than standard default inputs; using 21 periods for the short-term EMA, 55 periods for the longer-term EMA, and the standard value of 9 for the signal line.
Traders simply want to look for MACD crosses over the signal line, in the direction of the trend. Traders can look to close the position on the counter-signal; so if price is above the 200 period MA, the long position can be closed when MACD crosses DOWN and UNDER the signal line.
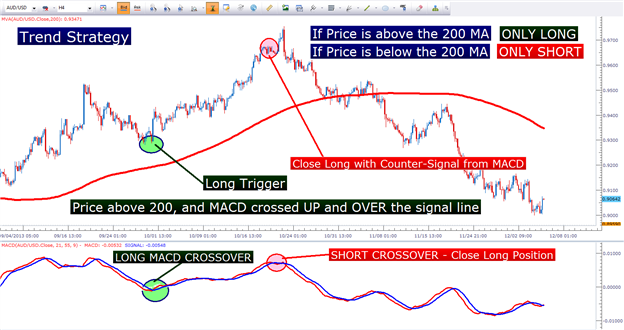
Created with Marketscope/Trading Station II
Ranges
Range-bound markets are generally less attractive to FX traders, and there are a couple of reasons for it. The potential profit from such a market is often smaller than that of a strong trend, or a breakout. And the potential risk may be higher, because if a trader is in a range, and prices break in the wrong direction against them – the potential cost could be enormous.
But, just as we had seen in The Best Time of Day to Trade FX , range-bound markets can still be profitable environments for traders if approached correctly.
Traders approaching range-bound markets need to make sure that they are employing a complete approach, utilizing risk management for every entry that they’re taking.
But, just as we had done with the trend strategy, we can use indicators to isolate and concentrate on environments with which we want to look. We outlined this strategy in the article, When the Market Gives Ranges, Trade Ranges!
For this purpose, ADX of 13 periods can be of great help. The Average Directional Index can be a phenomenal tool for grading trend strength; or more to the point for our concerns: ADX can help traders see a LACK of a trend.
Traders can look for values below 35 on ADX to define a range-bound environment. If values are below 35, traders can look to trigger in to the range; but if ADX is above 35, the trend can be classified as ‘too strong’ for range-trading.
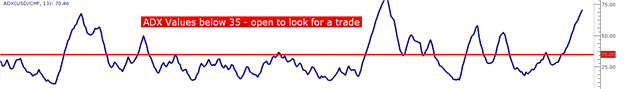
Taken from When the Market Gives Ranges, Trade Ranges!
Once a range has been found, traders can then look to trigger long or short based on the Commodity Channel Index (CCI) indicator . Crosses up and over -100 would be a trigger for a long entry; while crosses down and under +100 would be a trigger for a short entry (shown below):
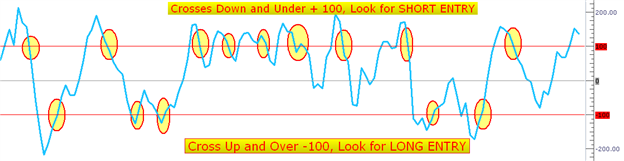
Taken from When the Market Gives Ranges, Trade Ranges!
Traders can look to exit positions with the counter signal from CCI, so that long positions are closed as short positions are initiated with crosses down and under +100 (assuming that ADX is still below 35 at the time).
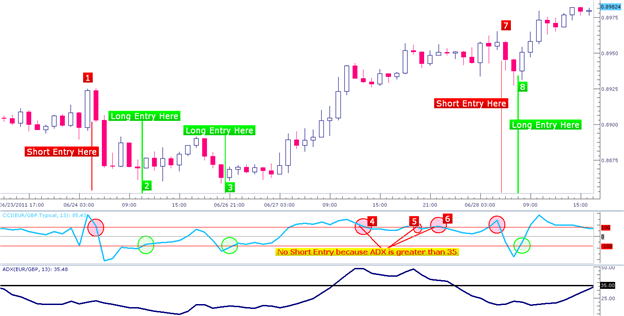
Taken from When the Market Gives Ranges, Trade Ranges!
Risk management can be done in a variety of ways in this strategy. My personal preference is to integrate price action to find swing lows to place stops for long positions, and swing highs to place stops for short positions . This way, if the range is broken, I can get out as early as possible.
But traders can also look to indicators such as Average True Range to assist with setting stops in this strategy.
Breakouts
Breakouts are, hands down, the most dangerous market condition for traders to approach. Price can break quickly in both directions, for OR against the trader. False breakouts can be abundant, and then managing risk is even more daunting.
Traders should approach breakouts with a degree of caution, looking to be even more aggressive when they hit a move, because the odds of hitting a breakout will generally be smaller than that of a range or trend.
And because a breakout is, in essence, just the opposite of a range, we can even integrate some of the logic from our previous strategy to look for breakouts.
Traders can, once again, look to the ADX indicator to filter trade opportunities; and if ADX is below 35, traders can look for breakouts.
Breakout positions can be entered via entry orders placed at the upper, or lower 21 period price channels ( often called ‘Donchian Channels’ after famed speculator Richard Donchian ).
Breakouts can be complimented by Price Channels
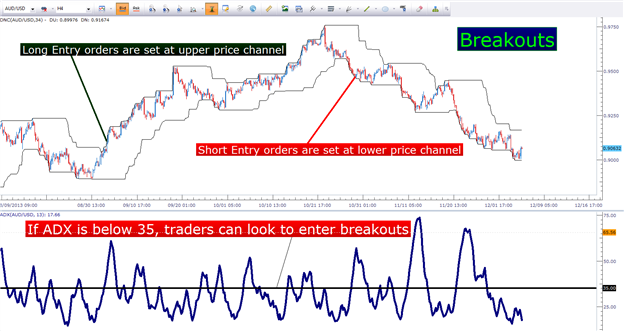
Created with Marketscope/Trading Station II
Risk management can, once again, be undertaken in a variety of ways. My personal preference is to look at price action. Average True Range can be a phenomenal way of looking for indicator-based risk amounts.
Whatever manner you choose for setting stops with this, or any breakout strategy; traders are often best advised to look for a minimum 1-to-2 risk-to-reward ratio.
-- Written by James Stanley
James is available on Twitter @JStanleyFX
To join James Stanley’s distribution list, please click here .
Would you like to get better with Price Action? Please feel free to take our 15 minute course on the topic. You’ll first be asked to sign the guestbook, which is completely free; and then you will be met with the video-based lesson via Brainshark.
Price Action Presentation via Brainshark
We’ve recently begun to record a series of Forex Videos on a variety of topics. We’d greatly appreciate any feedback or input you might be able to offer on these Forex videos: