Article Summary: Is the EURCAD trend coming to an end? Learn to identify market turns with MACD Divergence.
MACD has many uses, and is considered to be one of the most widely used market tools in trading. While most traders traditionally use MACD line crossovers for market entries, this momentum oscillator can also be used to identify market reversals. Today we will review market divergence and how it can be traded using MACD.
Find the Trend
Before we can spot a reversal or divergence, we need to identify a strong trend. The EURNZD 8Hour chart is an excellent example of an uptrend. Moving 749 pips over 6 weeks the EURNZD steadily climbed to higher highs to its peak at 1.3815. From this point, the currency pairs has declined over 386 pips leaving traders to wonder if a reversal may be in play.
To find out, let see how MACD compares with our price action.
Learn Forex – EURCAD 8Hour Trend
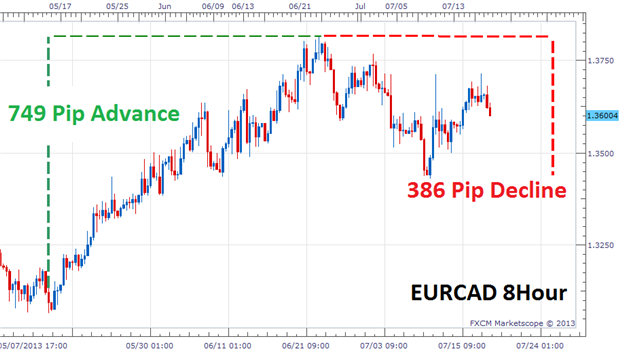
(Created using FXCM’s Marketscope 2.0 charts)
Spot Divergence
Now we are ready to identify divergence on our chart! The next step is to add MACD to our chart and look to identify if price is separating from the direction of our indicator. In an uptrend like the EURCAD, traders will reasonably be expecting MACD to move higher as price surges to higher highs. Below we can see the separation of the indicator from price. While the EURCAD is forming higher highs, MACD is seen making a series of Lower highs.
An easy way to identify divergence is to simply draw a trendline on your chart. In an uptrend, since we are comparing previous highs, we will need to connect the highs of price along with the highs on MACD. It is important that we draw these lines from a common beginning point as to ensure that we are comparing the same points on our graph. If these two lines are moving apart (diverging) in separate directions, the momentum of our current trend may be concluding.
Learn Forex – EURCAD Divergence
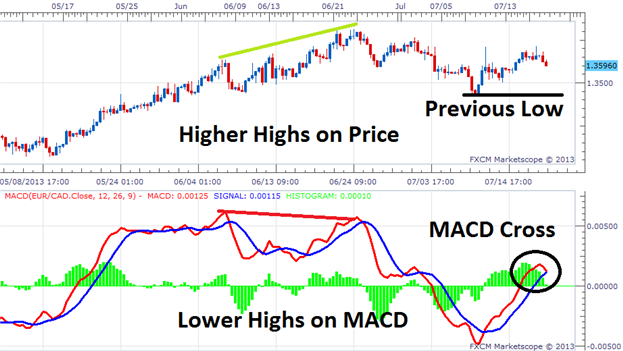
(Created using FXCM’s Marketscope 2.0 charts)
Trade Divergence
Now that divergence is identified, traders may begin looking for trades in the direction of the new trend. One of the easiest ways is to again refer to MACD and trade a crossover to pinpoint a turn in price in the newly identified direction. Or if a trader seeks added confirmation, a breakout strategy may be employed. If price declines to a lower low this would be another symbolic move by price action signaling a new market direction.
Lastly traders should always consider risk. In the event that price turns to higher highs back in the direction of previous momentum, divergence traders should look to exit the market.
---Written by Walker England, Trading Instructor
To contact Walker, email [email protected] . Follow me on Twitter at @WEnglandFX.
To be added to Walker’s e-mail distribution list, send an email with the subject line “Distribution List” to [email protected] .
Take this free 20 minute “New to FX” course presented by Education . In the course, you will learn about the basics of a FOREX transaction, what leverage is, and how to determine an appropriate amount of leverage for your trading.
Register HERE to start your FOREX learning now!
Here’s another great resource if you’re new to FX? Watch this video