Building a Better Indicator
The benefits of Multiple Time Frame analysis can be huge to traders, key of which is being able to see the forest from the trees in regards to longer-term trends in regards to near-term momentum.
In The Time Frames of Trading , we looked at exactly how traders could look to implement Multiple Time Frame Analysis into their approach based on their goals and desired holding time. We went over an example of such a strategy in our recently published article, Three Simple Strategies for Trading MACD .
A recent addition to the Trading Station platform has made trading with Multiple Time Frames easier than ever. No longer is a separate chart needed for each time frame, as traders have the ability to build indicators based on any time frame longer than their current chart.
How to Build Indicators on Different Time Frames
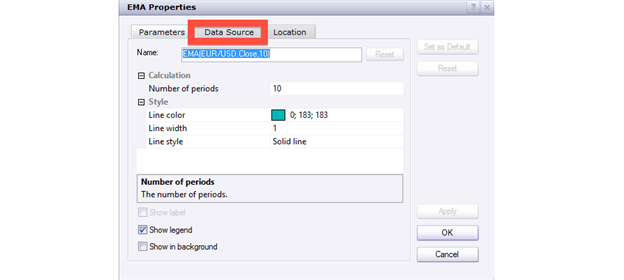
When applying any indicator on Trading Station, simply look to the ‘Data Source’ tab of the indicator’s properties menu.
The picture below is what a trader will see upon applying an Exponential Moving Average on their chart. Notice the ‘Data Source’ tab highlighted with the red box.

The ‘Properties’ window when adding an indicator to Trading Station II
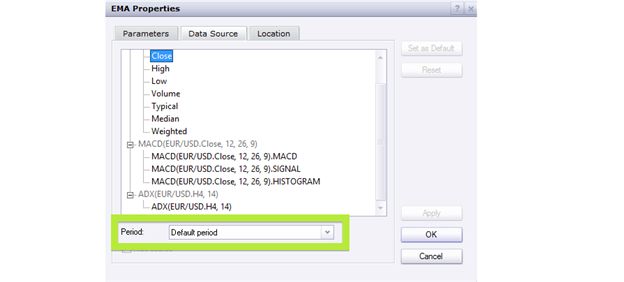
After clicking on the ‘Data Source’ tab, traders have a litany of information at their fingertips. Below is what traders will see upon clicking on ‘Data Source,’ with a green box around the ‘Period’ drop-down.

The ‘Data Source’ tab of the Properties window of any indicator on TSII
By changing the input in the ‘Period‘ box, traders will have the option to build this indicator on any of the default time frames longer than the time frame of the current chart.
By default, all indicators are built on the ‘Default period,‘ which is simply the time frame of the chart that is being displayed.
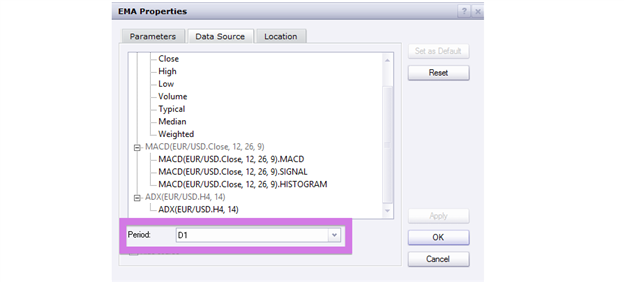
In our example with the Exponential Moving Average, we’re going to build the indicator on the Daily Chart for use with the Hourly Chart. The illustration below will show the ‘Period‘ box set to build the EMA on the Daily Chart (as denoted by ‘D1’).

The ‘Time Frame’ drop-down within the Data Source tab
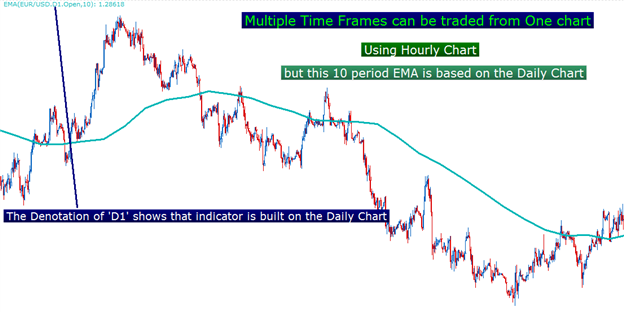
Now when we go back to our hourly chart, the EMA will be built and charted based on the Daily Values (despite the fact that we are using the hourly chart).

Created with Marketscope/Trading Station II
To contact James Stanley, please email [email protected] . You can follow James on Twitter @JStanleyFX.
To join James Stanley’s distribution list, please click here.
Would you like a customized curriculum to walk you through Trading Education? Take our Trader IQ quiz and receive a full lesson plan with numerous free resources to expand your information arsenal.
