The US Dollar has lost 4% of its value in the past 4 months. Rumors of QE3 coming from the US and European Central Bank’s announcement of an unlimited and sterilized bond buying program has helped fuel the latest round of USD selling.
The USD is approaching some significant support levels against 4 major currencies. Therefore, the US Dollar sell off may be mature and due to reverse.
We will look at:
EURUSD Near 2 Points of Resistance
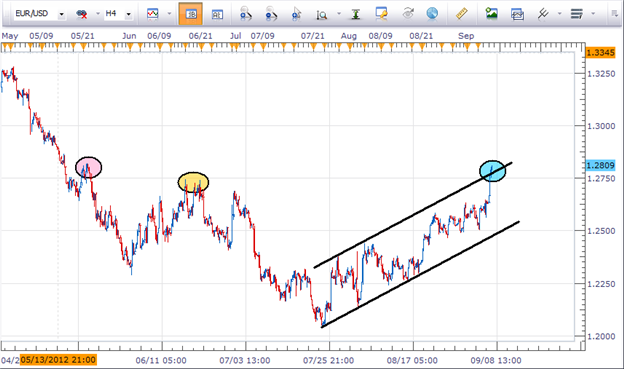
When the EURUSD approaches resistance that means the rally in the EUR is likely to stall and USD strength may re-emerge. A move to the downside means the USD is gaining strength.
There are 3 points of resistance which could suppress future price advances.
- Prices are at the top of a trend channel (1.2770 - blue circle)
- Prices are near horizontal resistance from June 20 (1.2746 – gold circle)
- Prices are near horizontal resistance from May 21 (1.2823 – pink circle)
(Created using FXCM’s Marketscope 2.0 charts)
A break back inside the trend channel will alert us that a potential reversal may be taking place.
GBPUSD near Fibonacci Resistance
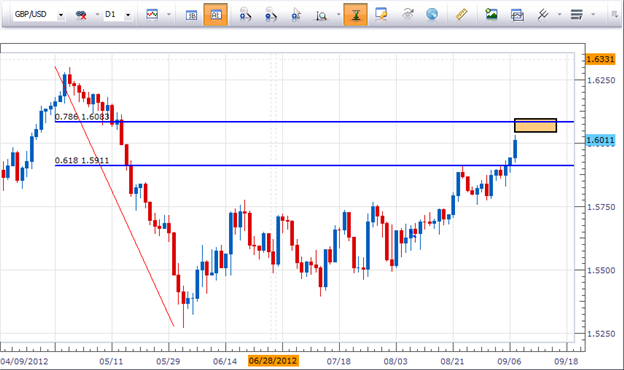
When the GBPUSD approaches resistance that means the rally in the GBP is likely to stall and USD strength may re-emerge. A move to the downside means the USD is gaining strength.
(Created using FXCM’s Marketscope 2.0 charts)
The downtrend from April 30 2012 to June 1, 2012 is currently seeing a partial upward retracement. Prices stalled near the 61.8% retracement and just pushed above in the last 2 days. Currently, prices are approaching an important resistance level of 1.6083 which is the 78.6% retracement level.
Though relatively unknown, the 78.6% Fibonacci retracement is considered by many traders to be the retracement of last resort. Traders like this level because it can afford a good chance at a good risk to reward ratio.
Will Old Support Turned New Resistance Hold the AUDUSD Down?
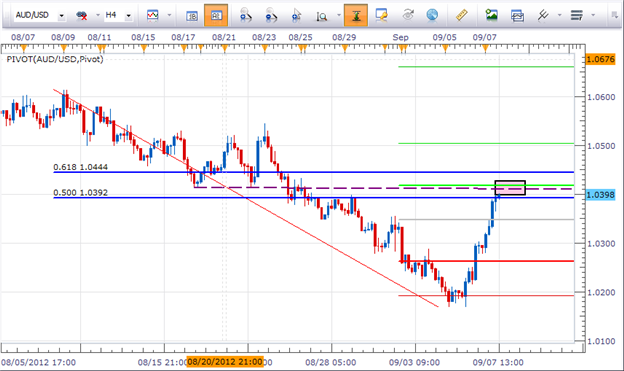
When the AUDUSD approaches resistance that means the rally in the AUD is likely to stall and USD strength may re-emerge. A move to the downside means the USD is gaining strength.
(Created using FXCM’s Marketscope 2.0 charts)
There are 3 points of resistance converging in the same price area.
- Monthly R1 Level is 1.0418 (light green line)
- Horizontal support turned new resistance 1.0412 (dotted purple line)
- The 50% retracement of the Aug 8, 2012 to Sept 5, 2012 decline is 1.0392 (blue line)
Therefore, the 1.0392-1.0418 price zone (pink box) may act like resistance and push the AUDUSD lower.
USDCAD Finalizes the Triangle Pattern
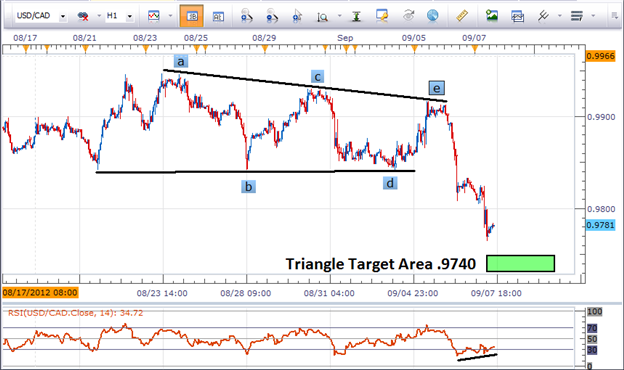
A move higher means the USD is gaining strength against the CAD .
(Created using FXCM’s Marketscope 2.0 charts)
A triangle pattern has been forming since the swing low of August 21, 2012 formed. The triangle consists of 5 waves with a final push out of the pattern in the direction of the preceding trend.
Yesterday, we saw the push take place as prices reached below the August 21 low. A target measurement of the pattern shows .9740 as a potential target area. One clue the decline is slowing is the divergent momentum appearing. The price is reaching a lower low while the RSI indicator is carving out a higher low.
Conclusion
In conclusion, the evidence from these 4 markets show some type of US Dollar bump is in the neighborhood. I am concerned about the heavy buyers of Dollars according to FXCM’s Speculative Sentiment Index . Therefore, I will look for the SSI figures to lessen before implementing a break out strategy to let the market prove to me it is willing to trade towards Greenback strength.
---Written by Jeremy Wagner, Lead Trading Instructor, Education
To contact Jeremy, email [email protected] . Follow me on Twitter at @JWagnerFXTrader.
To be added to Jeremy’s e-mail distribution list, send an email with the subject line “Distribution List” to [email protected].
New to the FX market? Save hours in figuring out what FOREX trading is all about.
Take this free 20 minute “New to FX” course presented by Education. In the course, you will learn about the basics of a FOREX transaction, what leverage is, and how to determine an appropriate amount of leverage for your trading.
Register HERE to start your FOREX learning now!
Looking for a strategy to trade? Take our free Relative Strength Index (RSI) training course and receive buy and sell rules on a strategy that uses RSI.
Register HERE to participate.