Balancing a primary daily trend and a short term secondary trend can be difficult for many novice traders. With different time frame graphs pointing in two separate directions, it can be extremely difficult to find a directional bias to place trade. Today we will review the AUDUSD using both a daily and 30minute chart to find momentum. This analysis will ultimately allow us to consider a variety of trading opportunities regardless of future market direction.
AUDUSD
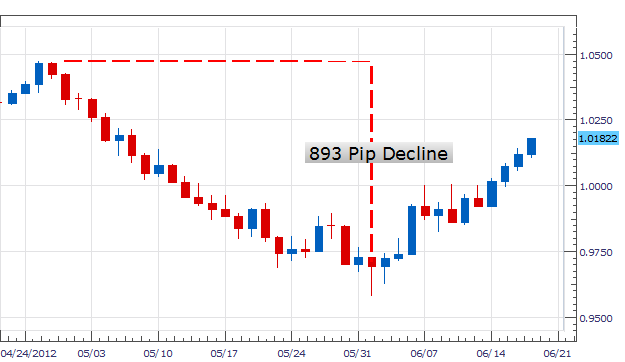
Pictured below we can see a daily chart of the AUDUSD. From its 1.0473 high created on April 27th price has declined as much as 893 pips lower. This is representative of strong downtrend momentum as the AUDUSD formed lower lows through the June 1st NFP announcement. However, through the month of June the AUDUSD has advanced against the daily trend but has yet to form a new high. Keeping this in mind longer term traders will continue to look for opportunities to sell strength under 1.0473. One way to accomplish this is to monitor a shorter term graph.

Building Blocks
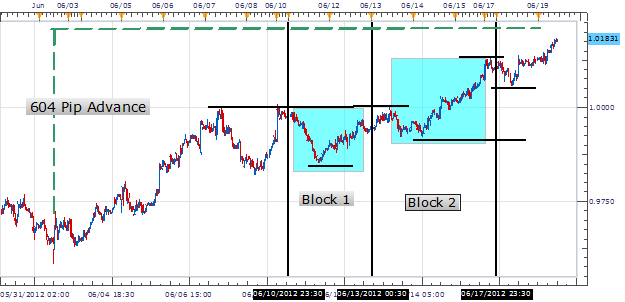
We can better understand the current upswing and short term momentum on the AUDUSD by zeroing in on our building blocks of trend development, using a 30 minute graph. After the steep dip in price mentioned above, the AUDUSD has advanced as much as 604 pips from our June 1st low through todays standing high. By blocking off our previous Monday & Wednesdays we can see price momentum steadily increasing with both Block 1 and Block 2 forming higher highs. Price has currently advanced over the Block 2 high showing that a fresh blue up block will be printed at the conclusion of Wednesdays trading. Short term momentum traders may be inclined to trade higher highs as long as no lower lows are created.

Which Direction to Trade?
Using the analysis above, long term traders may look for the establishment of lower lows on our 30 minute graph before entering into the direction of the daily trend. An invalidation of the short term trend would occur upon price breaking out to lower lows first under 1.0056 then under the standing Block 2 low at .9921. These points can be used for a potential breakout in the direction of the daily trend.
Short term traders can use the same information to trade upward momentum as long as price continues making higher highs. If no new higher highs are formed, this may signal a resumption of the broader trend. Confirmation may come occur upon price breaking out to lower lows first under 1.0056 then under the standing Block 2 low at .9921. These points can be used for a shift in trading bias with short term traders then looking to establish fresh sell positions in the direction of the daily trend.
---Written by Walker England, Trading Instructor
To contact Walker, email [email protected] . Follow me on Twitter at @WEnglandFX.
To be added to Walker’s e-mail distribution list, send an email with the subject line “Distribution List” to [email protected] .
provides forex news on the economic reports and political events that influence the currency market. Learn currency trading with a free practice account and charts from FXCM.
