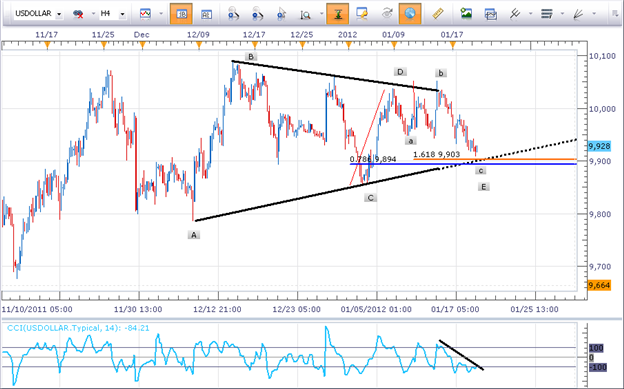
The U.S. Dollar Index is near a confluence of support levels near 9900. Also, there are several pattern targets near 10,265-10,290. This offers us a good chance at a good risk to reward ratio trade to buy the USDollar.
As the stock markets have pushed higher to begin 2012, the USDollar has moved in the opposing direction as traders sell idle dollars and put it to work in stocks. However, this relationship shows a turn could be just around the corner. The USDollar has not created lower lows as the Dow Jones Industrials creates higher highs indicating relative strength for the US Dollar should the market conditions turn for the better. We will look to trade this turn by trading a confluence of support and buying near 9900.

We have 3 different points of support converging near 9900.
- Round number support at 9900
- Triangle pattern support near 9900
- Wave pattern relationship showing a short term turn near 9900
Technical traders utilize round numbers as areas of support. Round numbers such as 9800, 9900, and 10,000 act like barriers in financial markets. (See Lesson 2 video on Support and Resistance inside Plus)
Secondly, we have a triangle pattern and trend line support converging near the same price level of 9900. Triangles, in Elliott Wave terms , occur in five waves A-B-C-D-E. Trading based on Elliott Wave is not needed to trade triangles as it can also be formed by simple support and resistance lines. Also, traders who are not familiar with triangle patterns may still see the support level and look to initiate new long positions at the upward sloping black line.
Lastly, there are a couple of wave relationships playing out near 9900. We find the 78.6% retracement of wave ‘D’ of the triangle at 9894. The 78.6% retracement level is considered by traders as the Fibonacci level of last resort. If prices aren’t supported there, they tend to move lower and create a lower low.
Also, within wave ‘E’ of the triangle, we have an a-b-c pattern that shows a potential terminal point of 9903. In Elliott Wave terms, waves a & c oftentimes have a Fibonacci relationship. This means wave c tends to be 61.8%, 100% or 161.8% of wave a. In this case, wave ‘c’ = 161.8% of wave ‘a’ near 9903.
This gives us a confluence of support near the 9900 where we will look for the entry to buy. Place your stop loss just below the low of wave ‘C’ at 9850. If prices push below there, the pattern interpretation is incorrect and we want out of the trade.
There is a confluence of wave relationships showing resistance near 10,250 so look to take profits before that point near 10,200. This gives us a 1:4 risk to reward ratio.
---Written by Jeremy Wagner, Lead Trading Instructor, Education
To contact Jeremy, email [email protected] . Follow me on Twitter at @JWagnerFXTrader.
To be added to Jeremy’s e-mail distribution list, send an email with the subject line “Distribution List” to [email protected].
For more advanced learning on the topics of support/resistance and Elliott Wave, log into the Plus On Demand Video Course !
