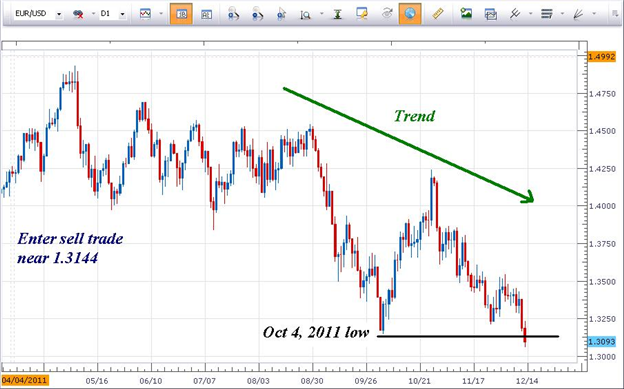
When the Fed embarked upon quantitative easing back on March 18, 2009, the market responded by immediately selling US Dollars and buying Euro ’s, Australian Dollars, and stock market exposure. As a result, the Greenback weakened significantly vaulting the EURUSD exchange rate higher as the supply of US Dollars would flood into the market.
We are nearly 3 years later, 2 quantitative easing programs further, and 1 bad day away from the Euro reaching below levels prior to March 18, 2009. There is extreme weakness in the single Euro currency with no relief in sight.
One way a trader can take advantage of the weakness is by trading breakouts. Identify a level of support and enter a sell trade when price breaks below the support zone.

We can see in the above daily chart of the EURUSD that the October 4, 2011 low broke a couple hours ago (1.3144). A trader would look to sell the EURUSD near the support zone with a stop placed just above a swing high near 1.3250.
This recent break below indicates that prices are wanting to trade into levels not seen since early October. That, by itself, indicates strength of the downward move.
As trend traders, we want to trade the strongest trends in the market and recent activity of the EURUSD indicates it is in a strong downward trend.
Additional Resources
How to Trade with Support and Resistance
Identifying the T r end (Video)
---Written by Jeremy Wagner, Lead Trading Instructor, Education
To contact Jeremy, email [email protected] . Follow me on Twitter at @JWagnerFXTrader.
To be added to Jeremy’s e-mail distribution list, send an email with the subject line “Distribution List” to [email protected].
