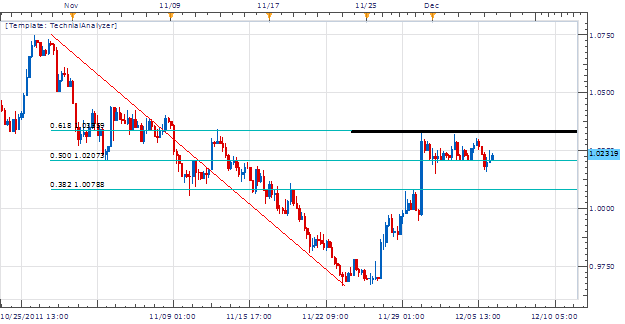
The AUD/USD remains in a holding pattern on its daily trend, finding resistance at its .618 retracement level as printed in the December 1st edition of Chart of the Day . For five trading days the pair has negated to make new highs or new lows. These sideways conditions are conducive for range traders, looking to buy and sell between points of support and resistance.
Taking Price in to a 2Hour chart we can begin seeing a well defined range develop. Resistance resides at our previously created high of 1.0329, on November 30th. Support is defined by our December 1st low of 1.0222. Once a range is defined, we can begin looking for entries against either support or resistance. One way to spot an entry trigger is to use the CCI oscillator as depicted below. Traders may patiently await the oscillator to move to overbought (100) and sell on a break back below to oversold (-100) levels.
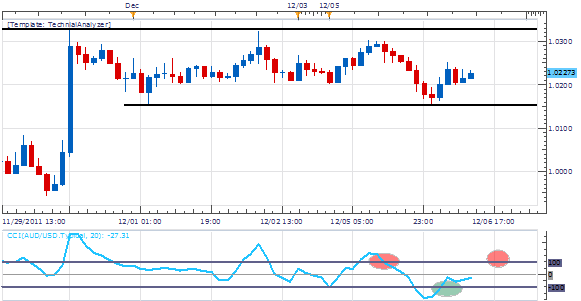
My preference is to sell the AUD / USD at 1.0300 or better using CCI as an entry trigger. Stops should be placed over resistance at 1.0350. Limits should be placed at 1.02000 for a clear 1:2 Risk/Reward profile.
Alternative scenarios include price continuing higher and breaking out of its range.
Additional Resources
---Written by Walker England, Trading Instructor
To contact Walker, email [email protected] . Follow me on Twitter at @WEnglandFX.
To be added to Walker’s e-mail distribution list, send an email with the subject line “Distribution List” to [email protected].
provides forex news on the economic reports and political events that influence the currency market. Learn currency trading with a free practice account and charts from FXCM.