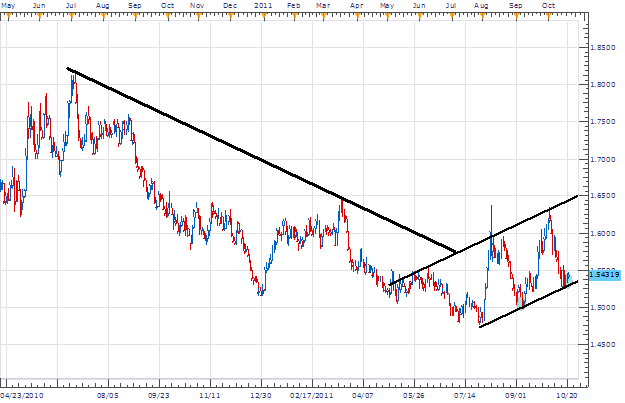
The GBP/AUD currency is an exotic currency offering song trends and many opportunities for technical pattern traders. While the pair has been trending downward for most of 2011, today we are looking at the potential of a price channel being formed with an upward bias. Traders will use a number of technical cues such as support and the SSD indicator to determine entry timing.
Channels are drawn by first finding support and resistance. Support can be found by matching up our lows. Currently our lowest low was printed on July 28th at 1.4759. We can match this point up with the September 7th and October 18th lows to form the base of our channel. Resistance is drawn by using a parallel bar marking off our highs in a similar fashion.
After finding support and resistance, we can now begin to look for entry’s on our channel. Adding the SSD Indicator (Slow Stochastics) with a 15, 5, 5 setting can be useful for finding shifts of momentum. Traders looking to buy the GBP / AUD will look for the %K line to close above the %D line. For more on this oscillator read, Stochastic Crossovers , linked here.
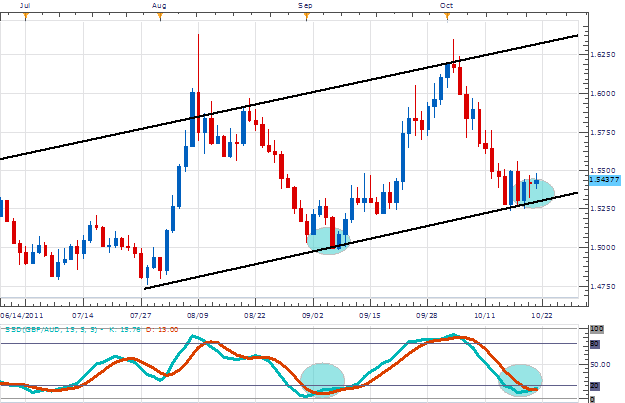
My preference is to buy the GBP/AUD using conformation from the SSD indicator. Entrys should be placed as near resistance as possible at 1.5450 or better. Stops should be placed 200 points away outside of resistance at 1.5250. Limits should look to first target half the channel at 1.5850 for a clear 1:2 Risk/Reward setting. Secondary limits may be placed at the channel high at 1.6250
Alternative scenarios include price breaking through support and moving on to new lows.
Additional Resources
---Written by Walker England, Trading Instructor
To contact Walker, email [email protected]. Follow me on Twitter at @WEnglandFX.
To be added to Walker’s e-mail distribution list, send an email with the subject line “Distribution List” to [email protected].