One of the questions most often asked of me is how does a trader know when the trend has changed.
While it is definitely an important question, it is also one of the many questions regarding currency trading that really does not have an absolute, cast in stone, black and white answer.
Take a look at the Daily chart of the USDCHF pair below…
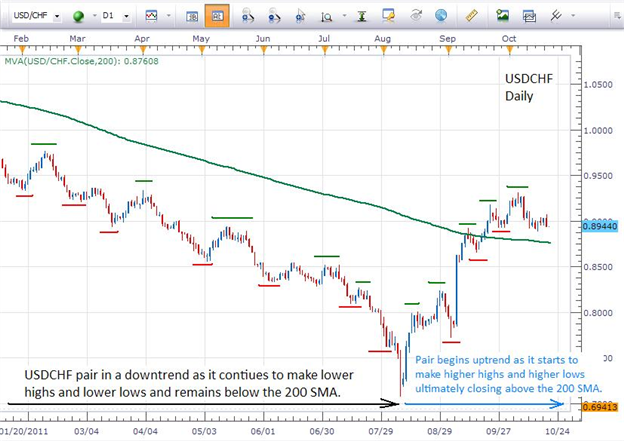
If we could extend the left side of this chart farther, we would see that the USDCHF pair had been in a downtrend from the end of May, 2010 until the beginning of August, 2011…roughly 16 months. It reached its lowest point on August 9, 2011 at .7481…the end of the black arrow.
So when did the uptrend begin?
Well, technically and in hindsight it began the next day, August 10, the beginning of the blue arrow, when the pair moved off that low and never looked back. Unfortunately, since we cannot tell the future, no one then knew that that was the end of the downtrend.
Let’s look at it this way and reverse engineer the process. How did we know the pair was in a downtrend? Well, price was making lower highs and lower lows; price was staying below the 200 SMA and distancing itself from it; and, during that time the USD was weaker than the CHF overall. OK…well if that is what makes a downtrend, it would stand to reason that the opposite of that would constitute an uptrend.
Here’s the problem with making a definite call, a cast in stone answer that the uptrend has begun…
On the chart above, once we see that price does not take out the lowest low but rather begins to build higher highs to the upside, it may be time for a trader to take note and table the idea of shorting the pair. But, has the trend changed? Maybe.
How do we know that the first time the previous low is not taken out and the pair starts to move to the upside that it is not just a pullback against the downtrend? And how do we know that when the pullback stalls that price will not, once again, move to the downside? The answer to both those questions is that we don’t…and therein lies the challenge of calling a trend change.
Let’s look at a combination of things…
- If the pair continues to make higher highs and higher lows and take out levels of prior resistance as it moves up, the pair is building an uptrend. The longer that process continues, the more likely it is that it will be a trend change. (How long is longer? Again, no black and white answer: Aggressive traders will call the trend change earlier and start taking longer positions sooner than will a conservative trader.)
- As price begins to move closer and closer to the 200 SMA, the closer it gets the more likely that we are looking at a potential trend change. (Once it trades through the 200 SMA and closes above it, that is strong confirmation that the trend has changed.)
- If the currency in the pair that had been the weaker currency has taken over as the stronger currency in the pair, and that change continues over time, that is pointing to the probability that we are looking at a trend change.
So while there is not a lot of certainty in calling a trend change in the short term, the above three items are what I monitor to determine if a trend is continuing, losing momentum and ultimately changing.