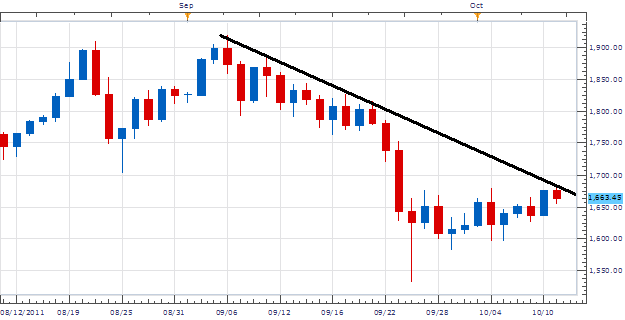
Gold (XAU/ USD ) continues to be out of favor due to its 20% decline from its $1920 high on September 10th to its September 28th low at $1532. Currently price is residing at resistance for our current down trend at $1680. At this critical point, gold will find itself either breaking to higher highs, or continuing its present descent to lower lows.
Fundamentally, Gold still remains the safe haven asset of choice. As the economic climate around the world slows many traders, investors and others are still parking their money in the metal. If world governments fail to decide on a plan of stimulus action and markets continue to decline Gold will likely be a direct benefactor. Likewise if there is light at the end of the tunnel, and an economic recovery on the way, it may signal a next leg down for Gold.
Taking Price in to a 4Hour chart we can see our well defined support and resistance lines of our triangle. Resistance is currently found over the October 10th high of $1682.61. Support is found under $1653.00 by connecting our rising lows ascending up to present price action. One method of trading triangles includes placing entry orders waiting for a breakout. This allows traders to cover both ends of the market regardless of direction.
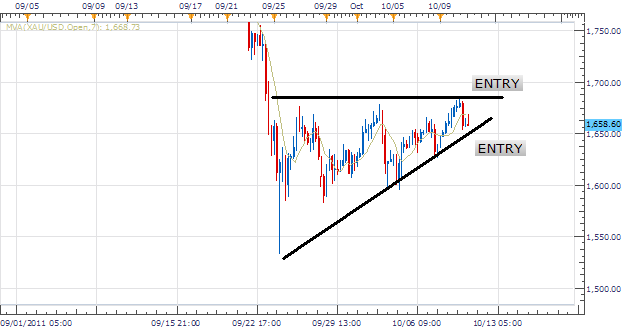
My preference is to bracket Gold (XAU/USD) utilizing entry orders. Entry’s to buy should be placed over 1,700 with the option to sell under 1, 6400. Limits should look for a minimum of $125.00. Stops should be set limiting $62.50 in risk for a 1:2 Risk/Reward Ratio.
Alternative scenarios include price continuing to consolidate prior to a break.
Additional Resources
---Written by Walker England, Trading Instructor
To contact Walker England please email [email protected]. You can follow James on Twitter @WEnglandFX.
To be added to Walkers’ distribution list, please send an email with the subject line “Notification,” to [email protected] .