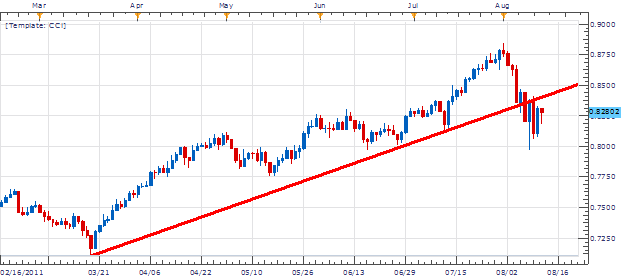
The NZD/USD has been experiencing a meltdown of late and has finally broken its uptrend channel line at .8838 on Monday of this week. The pair had previously been trending higher from the March low of .7108 up to the August 1st high at .8842. Since the original move lower, price has traded back higher contesting our now resistance line giving us trending chances in the direction of our breakout.
Fundamentally , the US Dollar mustered new found strength this week. US Jobless claims were released this week better than expected as well retail sales numbers were released today in line with expectations. Retail sales out of New Zealand are on the economic calendar for next week. Any bad news could be a new catalyst for this breakout to continue.
Price Action
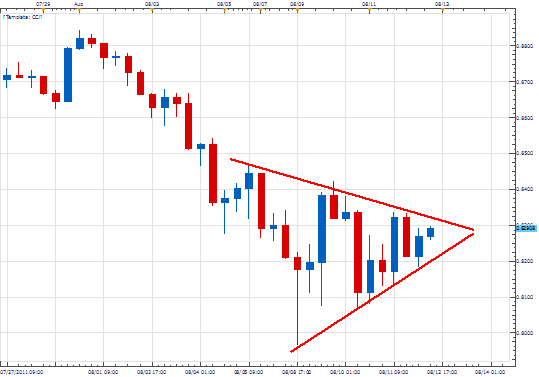
Moving to an 8H chart, price has noticeably consolidated in a symmetrical triangle pattern. As price moves towards short term resistance near .8315 we will begin looking for an entry to sell. A breakout strategy can also be used to join the trend under support at .8210. Using price analysis on our triangle a breakout below could extend 500 + pips if the pattern comes to fruition.
Trading O pportunity
My preference is to sell the NZD / USD on a test of the resistance established in our 8H triangle. Entrys should be placed near .8315. Stops should be placed over the March 9th high at .8440 or better. Limits will target .8065 at minimum, setting up a clear 1:2 Risk/Reward ratio.
Alternative scenarios include price trading towards daily resistance near .8415.
Walker England contributes to the Instructor Trading Tips articles. To receive more timely notifications on his reports, email [email protected] to be added to the distribution list.