Talking Points
- Dow Jones Industrial Average (DJIA) finishes the first week of January near the visible 20,000 mark
-20,000 remains a reactionary zone that may suppress prices
-A break above 20,000 opens the door to 20,600 and 21,300
DJIA finished the first week of the new year on a strong note coming within a whisker of the highly visible 20,000 mark.
It appears as if DJIA just finished a small flat correct last week that saw prices rocket higher. There is some congestion of wave relationship showing up near 20,000. A successful break above 20,000 opens the door to higher levels towards 20,600 and 21,300.
If prices dip, the selloff appears to be within the context of an uptrend and is likely to be supported at lower levels. A dip towards 19,000-19,250 would not be that unusual. A break below 18,600 would be a cause for concern that another pattern is at play.
Join Jeremy for his US Opening Bell webinars to discuss patterns for DJIA. Register and join here .
This is a shorter-term outlook for DJIA, for an equity market quarterly forecast grab a copy here .
Dow Jones Industrial Intraday Chart
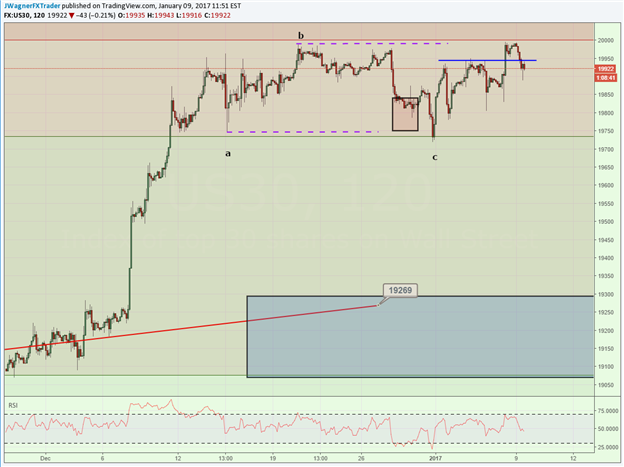
Created using TradingView
---Written by Jeremy Wagner, Head Trading Instructor, EDU
Follow me on Twitter at @JWagnerFXTrader .
See Jeremy’s recent articles at his Bio Page .
To receive additional articles from Jeremy via email, join Jeremy’s distribution list.