Talking Points:
- Crude Oil Prices Gain as Trading Reaches 2016 Highs
- Technical Indicators Remain Bullish
- Intraday Breakouts may Begin above $54.11
Crude oil prices are rallying higher this morning, after reaching a new 2016 high in yesterday’s trading. This surge is prefaced on an OPEC agreement that sees Crude oil inventories shrinking into the first half of 2017 . Going forward crude traders will be looking at $52.00 as a key point of support for the commodity if this current bull trend is set to continue. Technically, prices remain trading over a series of indicators including the 200 day moving average at $45.61 that also suggests that oil may continue to trade higher.
Crude Oil Price Daily Chart and Trend
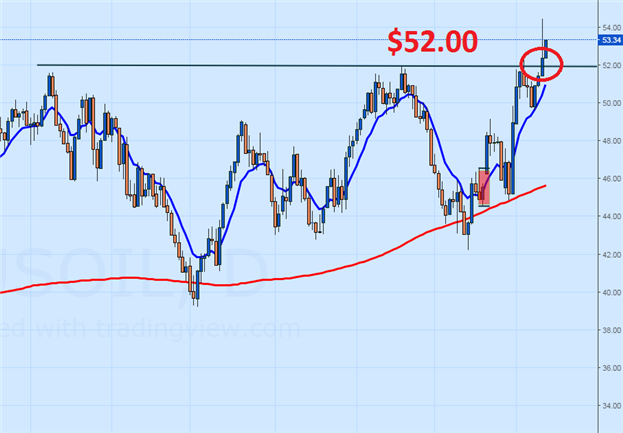
(Created Using TradingView Charts)
What’s next for Crude Oil and Commodities markets? Read Our Trading Forecast HERE
Intraday analysis, currently has oil trading near short term resistance near $53.24. If prices move through this point, traders will look for next resistance at the displayed R4 pivot found at $54.11. If price breaches this level, traders may be looking at another bullish breakout for the remainder of today’s trading session.
In the event that oil holds its present levels, we may see a shift in price back towards key values of support. This includes today’s S3 pivot found at $51.55. A decline to this point should be seen as significant as the market would have eliminated the majority of yesterday’s gains at that point. Further bearish momentum may begin under $50.70. This is the final point of intraday support for oil, and any further bearish declines could suggest a fundamental shift in the oil markets.
Crude Oil Price & Pivots
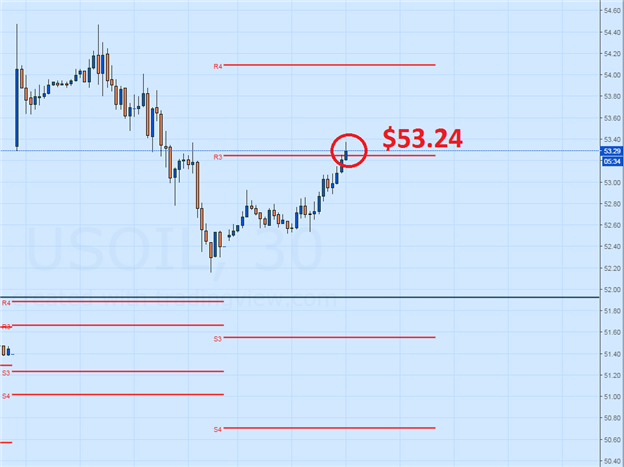
(Created Using TradingView Charts)
To Receive Walkers’ analysis directly via email, please SIGN UP HERE
See Walker’s most recent articles at his Bio Page .
Contact and Follow Walker on Twitter @WEnglandFX.