Talking Points:
- Copper Prices Trade Back Under Resistance at $2.4930
- Short Term Copper Trends Point Higher
- Looking for additional trade ideas for commodities markets? Read our Price Forecast
Copper prices have significantly declined after being rejected from a new 2016 high of $2.7333 per pound last week. With today’s trading being considered (-1.63%), Copper price are now set to close lower for the fourth consecutive session. What makes this move significant, is that the market is now trading back below $2.4930 which was previously marked as acting support and is now resistance for the commodity. If prices remain below this point, it may suggest that Copper is finally turning back in the direction of its multiyear downtrend.
Copper Prices Weekly Chart Resistance
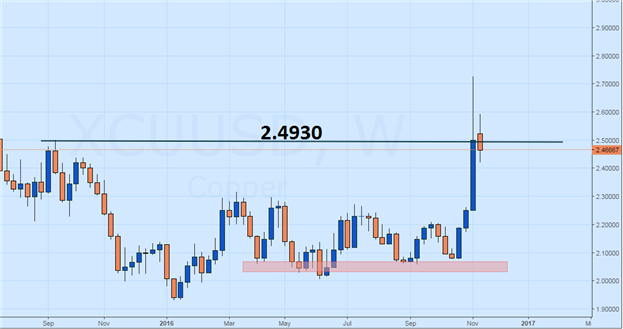
(Created Using TradingView Charts)
Traders looking for short term technical cues for a turn in Copper prices should continue to monitor the 10 period EMA (Exponential Moving Average). Copper has closed over this average for the preceding 16 periods, after the commodity first crossed the average on October 25th. Currently the average is sitting at $2.4186, and a move below this value would again suggest that the trend is shifting lower.
In the event that Copper remains supported near present levels, bullish traders will first look for the metal to trade back above the previously mentioned value of resistance at f $2.4390. Next, the metal will need to continue to advance towards higher highs to suggest a significant resumption of its prior short term uptrend. Key values of resistance include $2.5811 and $2.6321. Both of these areas must be overcome to add validation of any bull trend, but the commodity will ultimately need to create a higher high above the standing high at $2.7333.
Copper Price, Daily Chart with 10 Period EMA
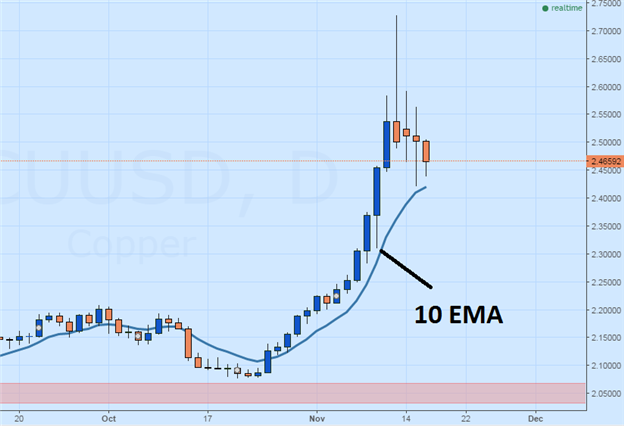
(Created Using TradingView Charts)
To Receive Walkers’ analysis directly via email, please SIGN UP HERE
See Walker’s most recent articles at his Bio Page .
Contact and Follow Walker on Twitter @WEnglandFX.